XLM SHORT · 4h
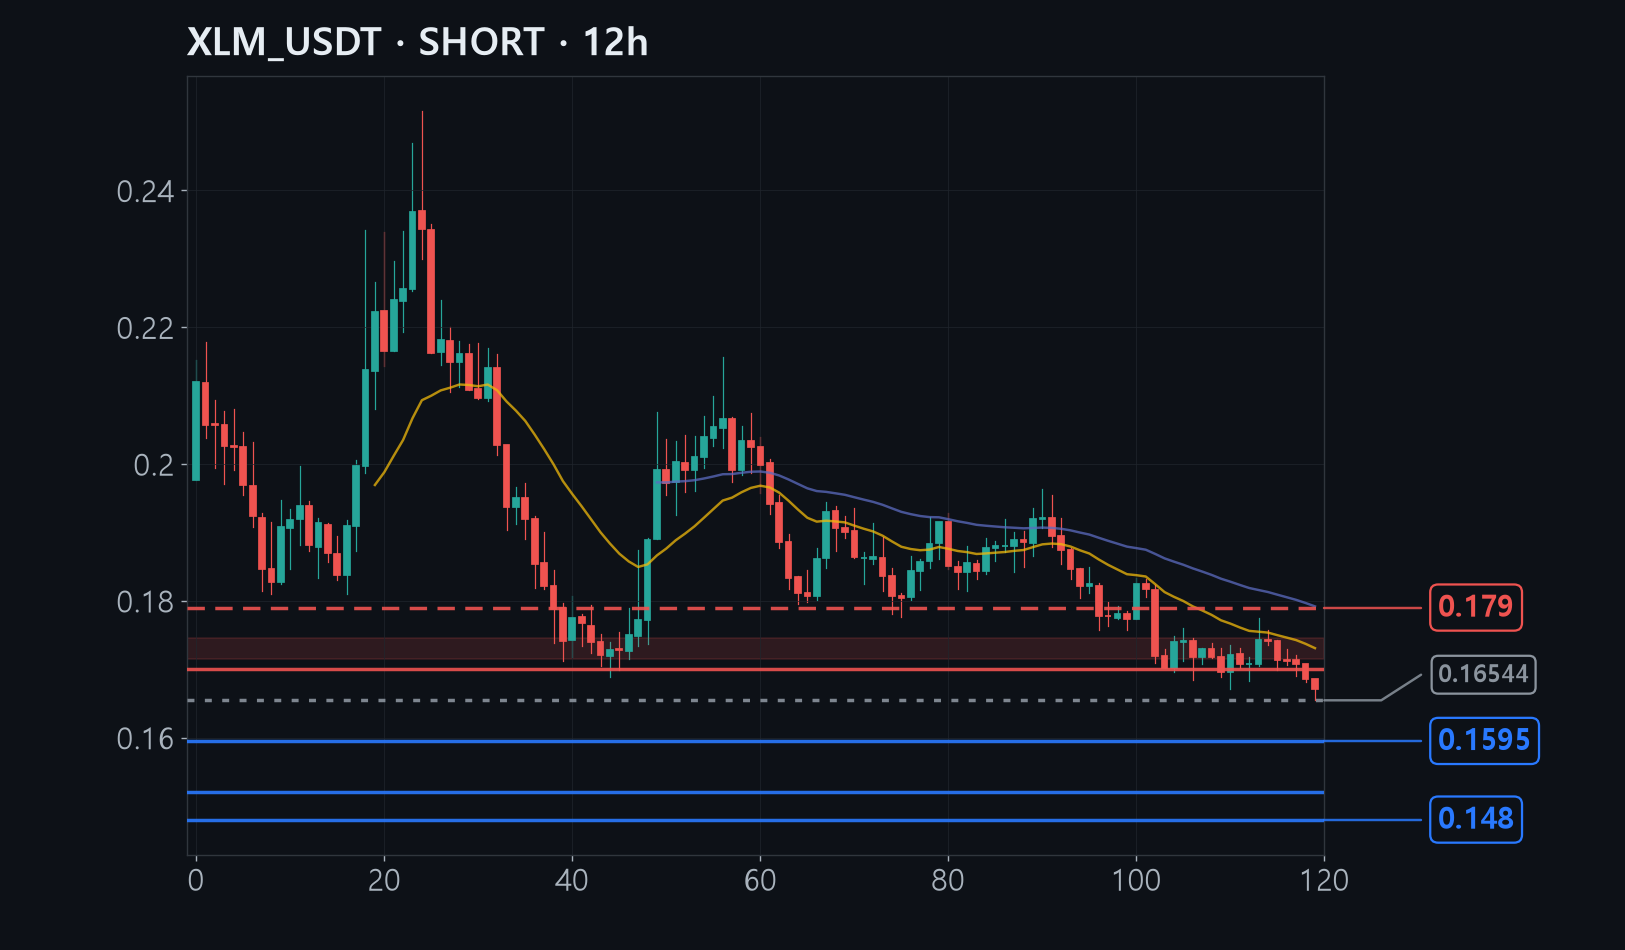
| Entry | 0.1715~0.1745 |
|---|---|
| Stop | 0.179 |
| Target | 0.1595 / 0.152 / 0.148 |
| R:R | 2.25 |
| Confidence | 58% |
Rationale
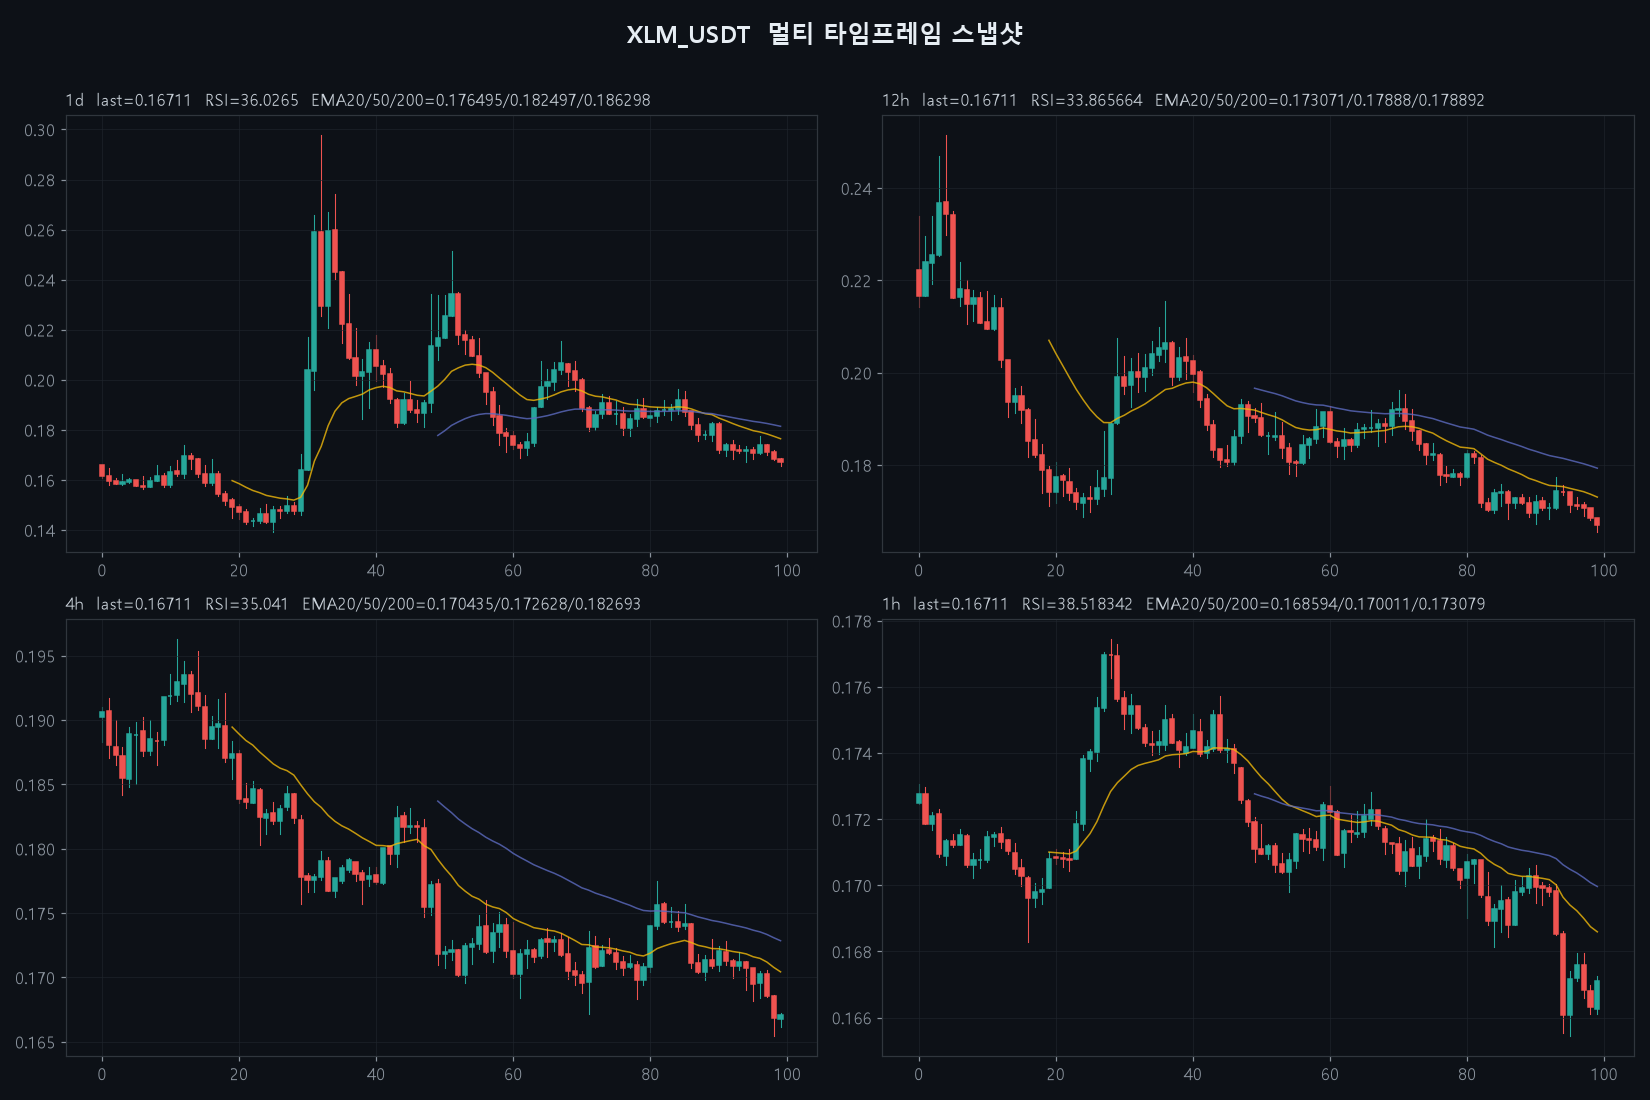
- The multi-timeframe trend points one way without exception. On the 1d, 12h, 4h and 1h charts the EMA stack is inverted at EMA20 < EMA50 < EMA200, and the current price of 0.16711 sits below every one of those averages. The gap to the 1d EMA200 at 0.18630 has widened to more than 11%, which itself signals that the downtrend is strong rather than merely drifting.
- Among the six perspectives that cleared the 2.0 reward-to-risk filter, the directional vote is SHORT 4 to LONG 2. More important than the tally is that the four short perspectives - ICT, Wyckoff, Elliott and Macro - arrived at entry zones of 0.1705-0.1749 that almost completely overlap despite being derived independently. When unrelated methodologies converge on the same price band, that convergence is itself the signal.
- The 0.1715-0.1745 entry zone is where four separate forms of resistance stack up. The optimal retracement zone of the prior 4h impulse leg from 0.17746 to 0.16544 (0.1729-0.1749), the 4h EMA20/50 band (0.17044-0.17263), the 1h EMA200 at 0.17308, and Elliott fourth-wave retracement resistance all cluster inside that narrow range. If a bounce fails to clear this wall, the probability of the markdown resuming is high.
- Macro points the same direction as the trend. On top of higher-for-longer rates and a firm dollar (DXY at 101), Bitcoin dominance is pinned at 58% so altcoin season has not begun - and most tellingly, XLM decoupled and lost its moving averages during the very week that XRP, its closest correlate, surged 84%. Failing to participate in a move it should have joined is strong evidence of relative weakness.
- The counterarguments are genuine, and they are why confidence is held to 58. A regular bullish divergence is active on the 1h (price making a new low while RSI rose from 25.9 to 32.6) alongside an extreme oversold bounce on the 15m, and negative funding at -0.000213 signals crowded shorts that can fuel a squeeze. That said, the 1d shows no divergence at all, leaving the signal counter-trend and unconfirmed - and paradoxically it is precisely this bounce that is required to reach the 0.1730 entry.
- The news fundamentals are bullish but their time axis is misaligned. $3.06B in real-world assets, the CFTC commodity classification and the DTCC and MoneyGram partnerships are all medium-term drivers, while the largest catalyst - the Wyoming symposium on 17-20 August - is twelve days out. The only news force that can actually operate inside this call's resolution window of 24 hours from publication is the bearish one, a 1.86% daily decline, so the bullish fundamentals lack the power to reverse direction for this round.
Analysis by methodology
On the 1d, 12h and 4h charts price keeps printing lower highs and lower lows, so the bearish break of structure is intact and the higher-timeframe bias is clearly short. The optimal trade entry zone (62-79% retracement) of the prior 4h impulse leg from 0.17746 down to 0.16544 sits at 0.1729-0.1749, which overlaps precisely with 4h EMA20/50 resistance (0.17044-0.17263) and the 1h EMA200 at 0.17308, creating a premium-zone sell area. Buy-side liquidity rests above 0.1730 and 0.17746 while sell-side liquidity sits at 0.16544 and the 0.16 round number, so a sweep higher followed by a move toward downside liquidity is the natural path. At 0.16711 price is already in discount, so a market short offers no reward-to-risk; entering at the 0.1730 midpoint with a 0.1790 stop and a 0.1595 first target yields 2.67R. A closing break above 0.1778-0.1785 invalidates this structure.
The large markdown phase that carried price from 0.25 down to 0.165 has not yet produced a credible stopping signal. The recent high-volume down candle (1.95M) reads as a sign of weakness, while the 0.16544 low came on comparatively light volume of 518k, which is too thin to confirm a selling climax or spring - the accumulation evidence simply is not there. A bounce into 0.1705-0.1730 is therefore better read as a last point of supply rather than the start of accumulation, and is used as a short entry. That said, if price sweeps below 0.16544 and immediately reclaims it on expanding volume, the classic spring interpretation takes over and the whole read flips, which is why confidence is held down at 50. With a 0.1790 stop and a 0.1595 first target the setup carries 2.29R.
The decline from the 0.19633 high counts cleanly as a five-wave impulse: 0.196 to 0.172 as wave 1, the bounce to 0.185 as wave 2, down to 0.170 as wave 3, a fourth-wave bounce, and wave 5 now unfolding around 0.16544. All three cardinal wave rules hold - wave 2 did not retrace beyond the start of wave 1, wave 3 is not the shortest, and wave 4 does not overlap wave 1 - so the count is structurally valid. Fibonacci extension places the wave 5 terminus in the 0.160-0.154 region, which lines up with the composite targets at 0.1595 and 0.1520. However, bullish divergence on the lower timeframes suggests wave 5 may be entering exhaustion, and a completed fifth wave is typically followed by a sharp corrective bounce, so profits should be taken promptly once targets are reached. That exhaustion risk is why confidence is set lowest here at 48.
This is the only perspective pointing long. On the 1h, RSI bottomed at 25.9 and then price made a new low at 0.16544 while RSI rose to 32.6 - a textbook regular bullish divergence - and on the 15m, RSI snapped back from an extreme oversold 17.6 to 44.8 with MACD crossing positive. The 12h MACD histogram has also turned from negative to +2.8e-05, confirming that downside momentum is decelerating. Critically, though, the 1d shows no divergence at all: price and RSI (36.0) made new lows together, meaning this is a counter-trend signal without higher-timeframe confirmation. Buying 0.1640-0.1660 with a 0.1622 stop and a 0.1720 target does produce 2.50R, but with all four higher timeframes in bearish EMA alignment this remains a bounce bet, so confidence stays at 52.
The macro backdrop is unfavourable for XLM. The Fed is on hold at 3.50-3.75% and energy-driven reflation has effectively killed expectations of a cut during 2026, while a dollar index at 100.9-101 and 10-year yields of 4.2-4.7% form a high-rate, strong-dollar combination that is a structural headwind for non-yielding altcoins. Bitcoin dominance is stuck at 58% and the altcoin season index sits at just 30-46, so capital rotation into alts has not begun. Most tellingly, XRP - historically XLM's tightest correlate - rallied 84% on the week while XLM instead lost its key moving averages and decoupled to the downside, reconfirming relative weakness. Adding the trend-following evidence of EMA20 < EMA50 < EMA200 across the 1d, 12h, 4h and 1h with price beneath every one of them, a retracement short at 0.1715-0.1745 delivers 2.25R. Strong risk appetite in US equities and negative funding (crowded shorts) remain the counterarguments, capping confidence at 58.
The fundamental news flow is unambiguously bullish. Stellar's real-world-asset tokenisation has reached $3.06B across 70 products - second only to Ethereum - with $6.45B in monthly volume and stablecoin supply up 38.3%. On top of that, the SEC and CFTC have classified XLM as a digital commodity rather than a security, removing regulatory overhang, while MoneyGram and DTCC partnerships and Tradable's plan to bring $1B of tokenised private credit onto the network underpin institutional adoption. The decisive limitation, however, is the time axis: almost all of these catalysts are medium-term in nature, and the single biggest one - the Wyoming Blockchain Symposium on 17-20 August with the SEC Chair attending - is twelve days away and therefore falls outside the resolution window of this 4h entry. The only genuinely short-term news item is bearish: a 1.86% 24-hour decline and a failure to clear range resistance. The desk's own scenario of entering 0.162-0.172 with a 0.155 stop and a 0.20 first target shows 2.75R, but a 0.20 target sits above even the 1d EMA200 at 0.18630 and is a medium-term objective unsuited to this timeframe, so only its directional vote was counted and its levels were not adopted.
Invalidation
The primary invalidation is the stop at 0.1790. That level sits above both the prior 4h swing high at 0.17746 and the 12h EMA50/EMA200 cluster at 0.17888-0.178892, and was placed there deliberately so that reaching it means the bearish structure itself has broken rather than merely that a wick tagged the level. Structurally, a 12h candle closing above 0.1789 would be the first sign that the all-timeframe inverted EMA stack is unwinding, so even without the stop being hit, that closing condition warrants cutting size and reassessing. There are two triggers that flip the thesis outright. First, if price breaks below 0.16544 and then immediately reclaims it on expanding volume, a Wyckoff spring is confirmed and the short view inverts to long, promoting the divergence scenario - buying 0.1640-0.1660 with a 0.1622 stop - to the primary case. Second, if price strongly recovers 0.17746 and turns the 4h EMA50 at 0.172628 into support, the move must be re-read as the early phase of a trend reversal rather than a retracement. Conversely, should 0.16544 collapse on heavy volume before the entry zone is reached, the completed decline will not be chased; instead the entry zone is revised down to 0.1690-0.1715 and re-entry considered only under the same structural conditions.
Context
The key pivot is 0.16544. That price registers simultaneously as the 50-bar low on all five timeframes - 1d, 12h, 4h, 1h and 15m - which tells us it is a freshly made low and that the entire market is watching the same level. It therefore acts as a magnet where sell-side liquidity is concentrated, and whether it holds or gives way is the fork in the road for this structure. Looking at the multi-timeframe picture, the 1d is a textbook descending channel with highs stepping down from the June peak at 0.25154 through 0.22, 0.20 and 0.18, while the 12h, 4h and 1h all show a fully aligned EMA20 < EMA50 < EMA200 inversion - a configuration in which any bounce runs into each moving average as successive resistance. This is precisely why the entry zone is placed above the market at 0.1715-0.1745 rather than at the current price: at 0.16711 price is already in discount just above the 0.16544 low, so a market short cannot generate 2.0R because the target is too near relative to the required stop distance. In the retracement zone, by contrast, the 4h EMA20/50, the 1h EMA200, the optimal retracement zone and Elliott fourth-wave resistance all converge on one spot, allowing the stop to sit outside the structure while the targets remain far away. The 4h label follows the same logic: entry, stop and targets are all derived from the 4h impulse leg (0.17746 to 0.16544) and the 4h moving averages, and the move should resolve within a day or two, so there is no case for stepping up to 1d. The macro backdrop of higher-for-longer rates and Bitcoin dominance pinned at 58% is unfavourable for altcoins, and the US CPI print on 12 August is the largest variable during this entry's shelf life.