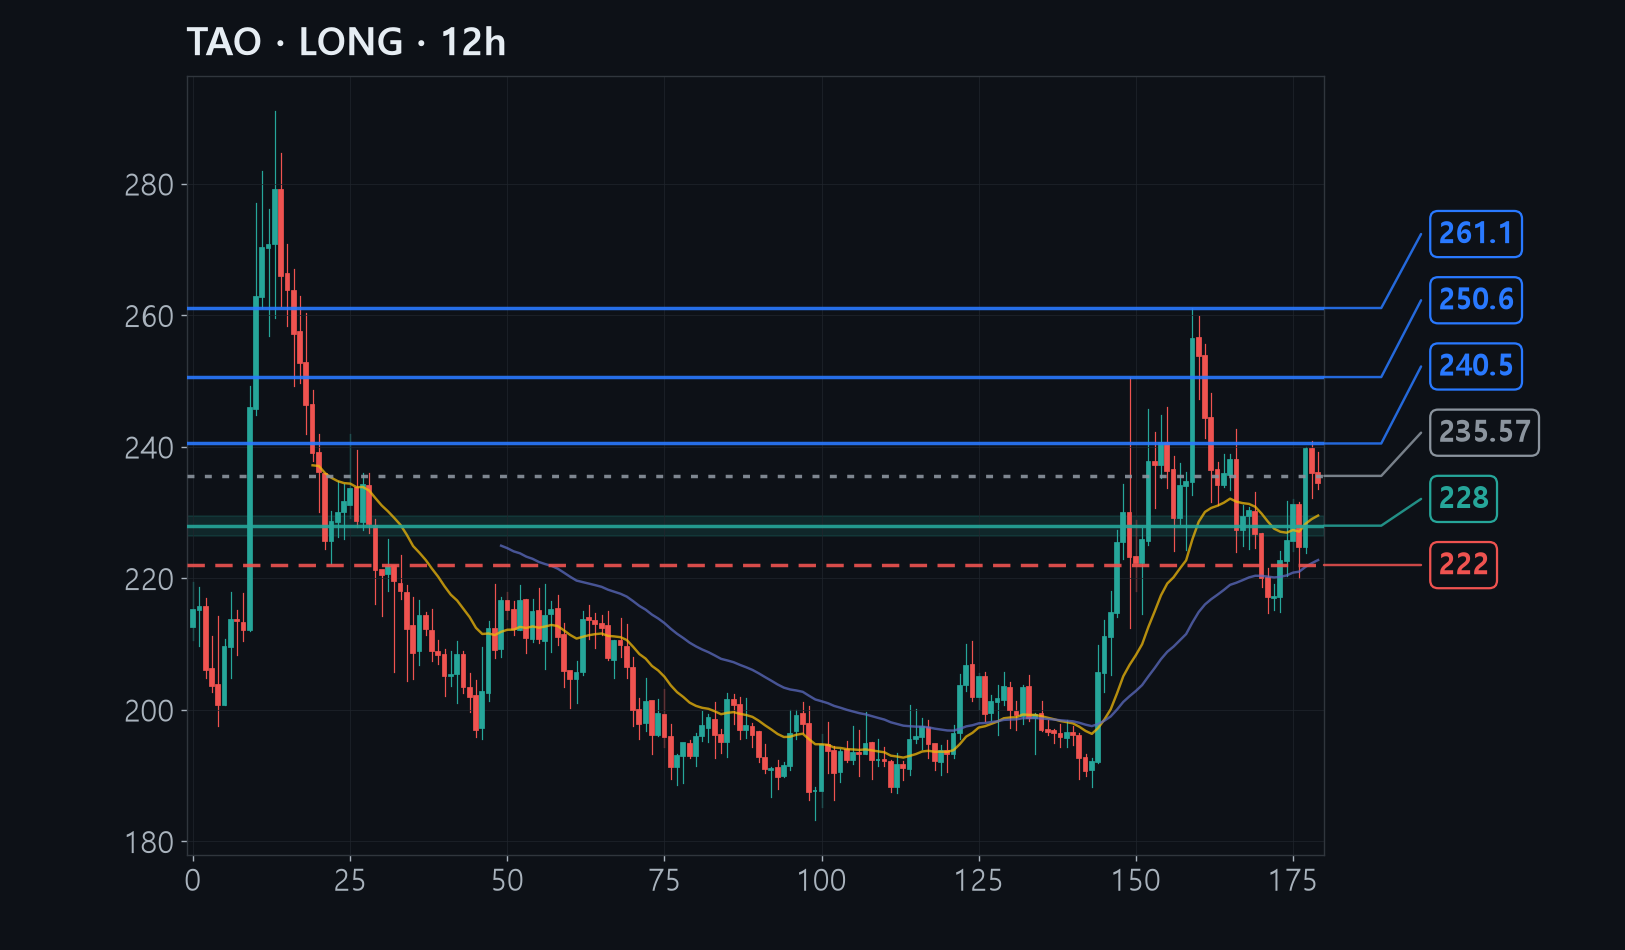
TAO fell from 261 dollars to 214 over the past ten days, then rebounded all the way back to 236 in just the last two days.
Around 226-230 dollars, three things overlap in one place: a 62% giveback of the recent rally, two short-term moving averages, and a support level that has already held three separate times.
If that thrice-defended 224 dollar support finally breaks, the bullish case is wrong, which is exactly why the stop sits just underneath it at 222 dollars.
The full analysis is for members
Analysis by methodology (ICT, Wyckoff, Elliott, divergence, macro, news), invalidation levels, R:R and confidence are in the member report.