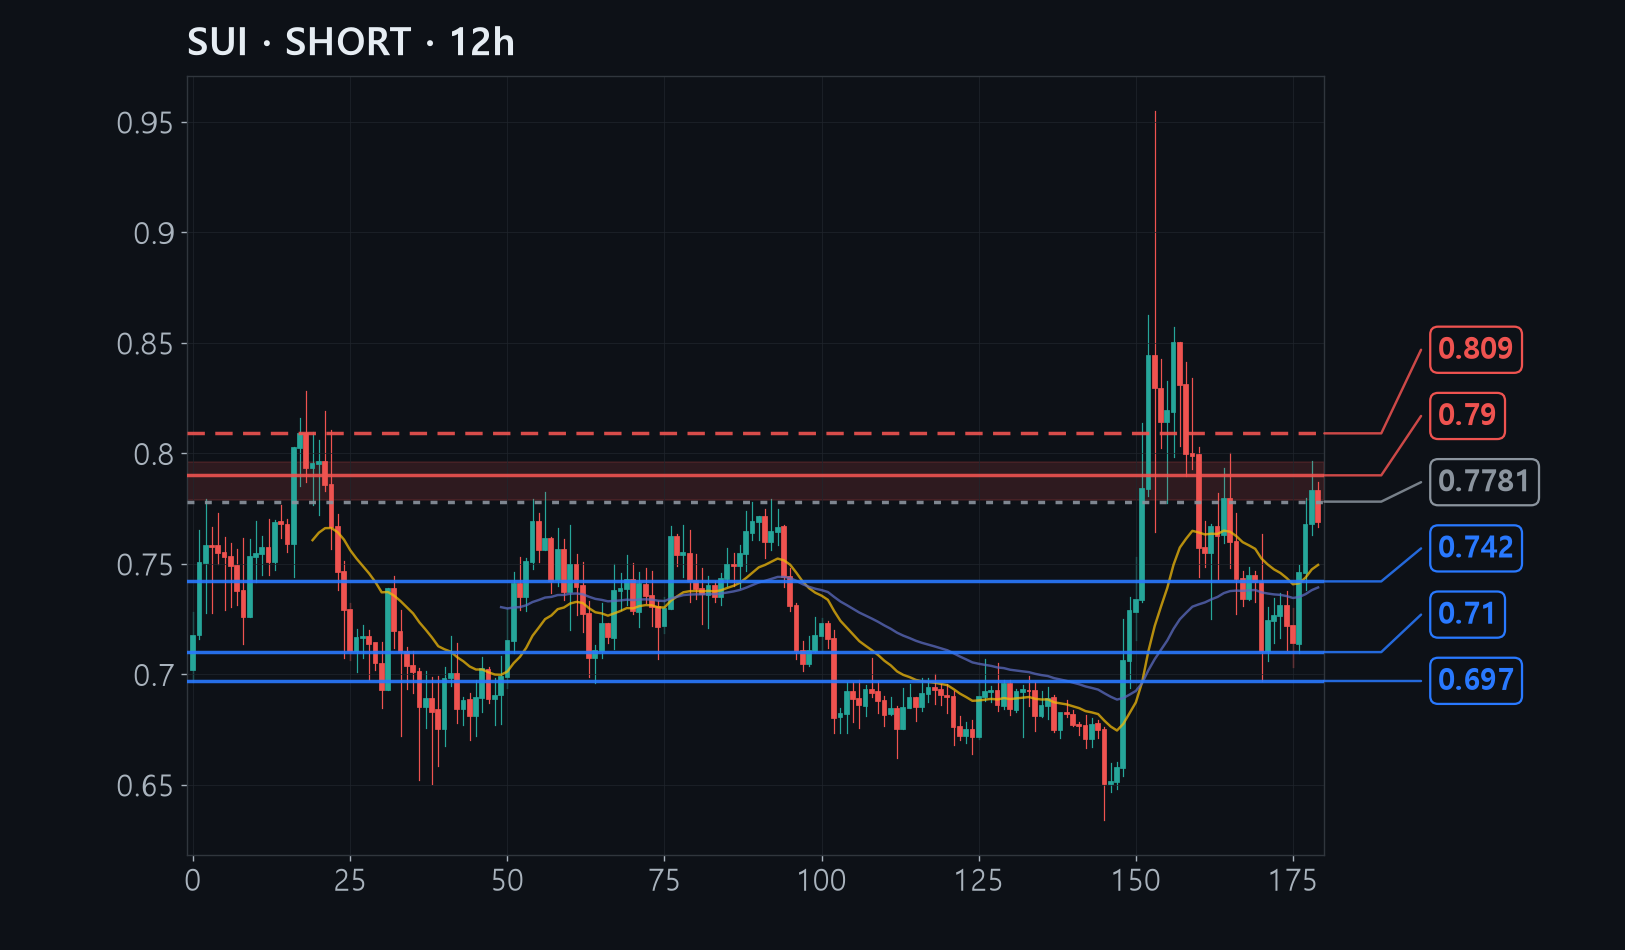
SUI slid from its August high of 0.955 down to 0.697 and has since recovered to 0.771, but it is still sitting inside a bounce within a broader downtrend rather than a new uptrend.
The 0.779 to 0.796 band is where the hundred-day average price line, the previous swing high, and leftover supply from sellers who missed the last spike all stack up together. That overlap is why we treat a rally into it as the place to sell.
If instead price climbs above 0.809 and holds there, it means this bounce really was a trend change, so the stop sits just above that level and the trade is cut immediately if we are wrong.
The full analysis is for members
Analysis by methodology (ICT, Wyckoff, Elliott, divergence, macro, news), invalidation levels, R:R and confidence are in the member report.