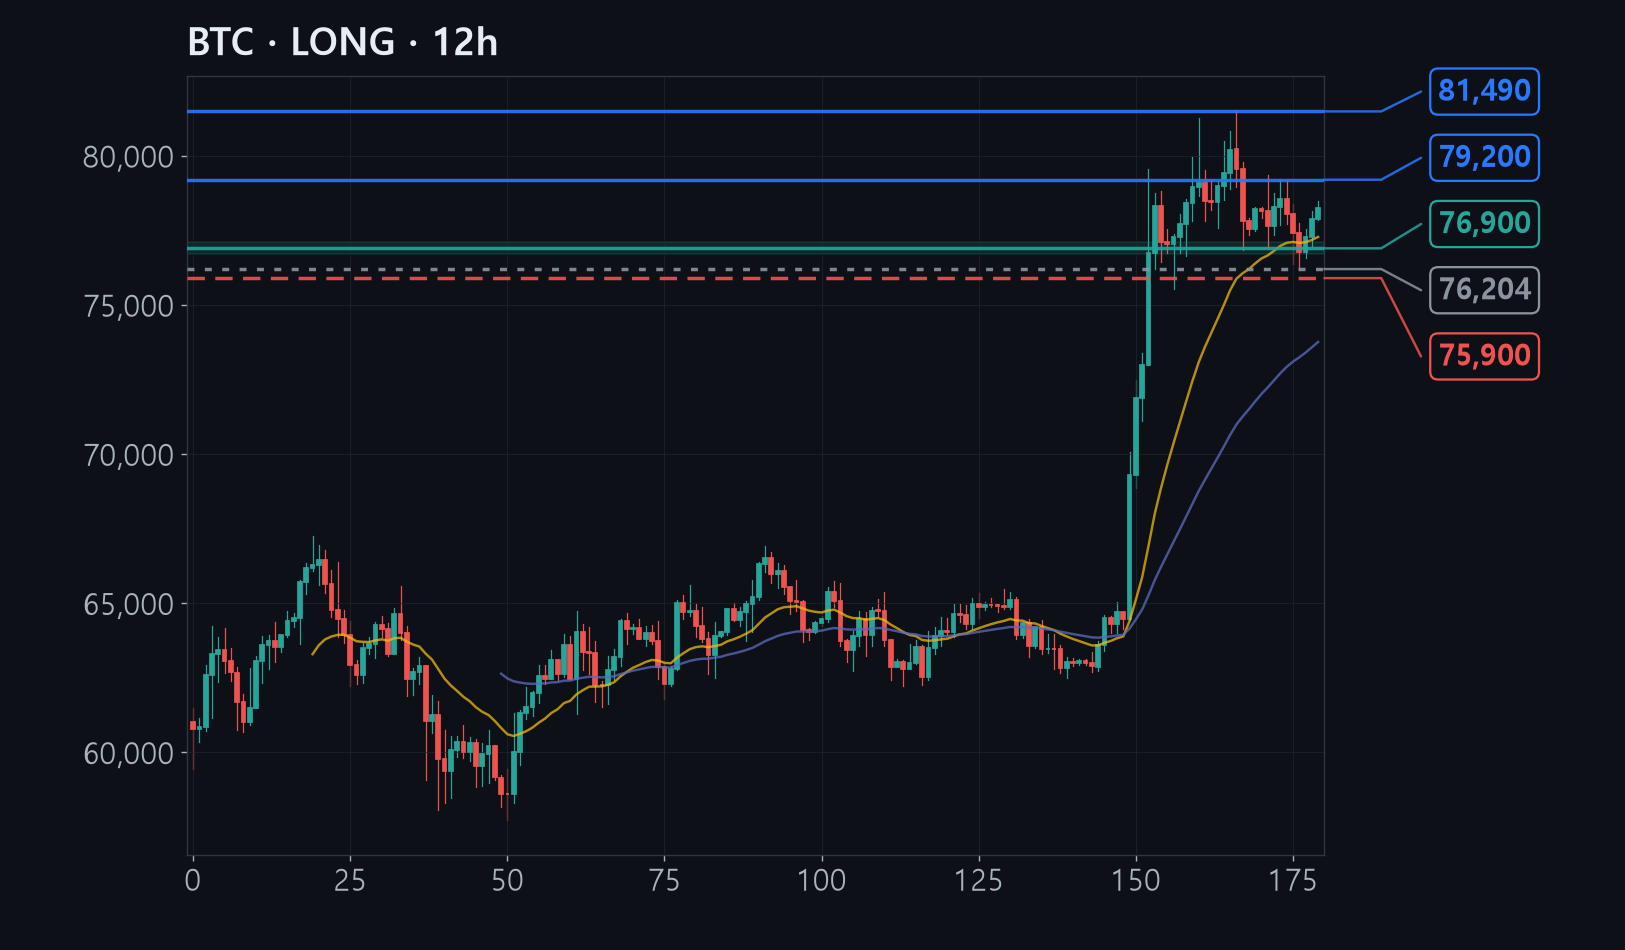
Bitcoin fell from its August high of 81,490 to 76,204, then reclaimed the 77,900 area, and its lows have been stepping steadily higher ever since.
Five of six analytical lenses lean bullish, and the level where sell stops were flushed, the most recent low, and the medium-term average price line all overlap between 76,700 and 77,100.
If 76,204 breaks on a 12-hour closing basis, this stops being a bounce and becomes a downtrend, which is why the stop sits just outside it at 75,900.
The full analysis is for members
Analysis by methodology (ICT, Wyckoff, Elliott, divergence, macro, news), invalidation levels, R:R and confidence are in the member report.