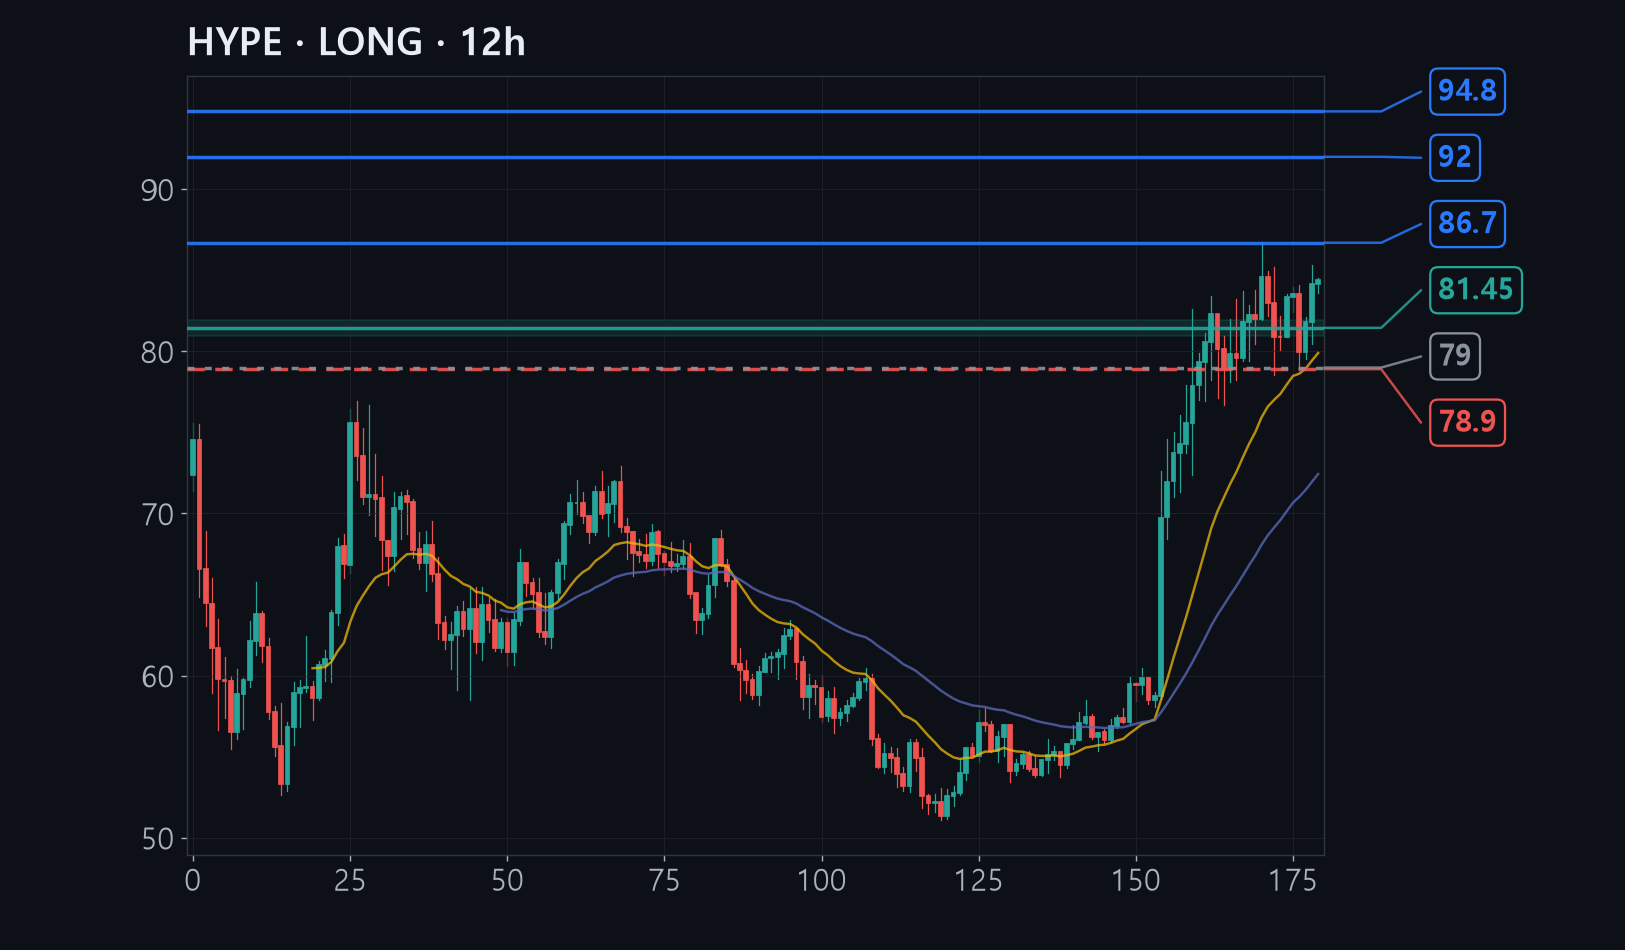
Hyperliquid printed an all-time high of 86.74 dollars on 27 August, pulled back 9%, and has spent six days building a base above 79 dollars.
Its lows keep stepping up - 76.7, then 78.5, then 79.0 - and the 81-82 dollar area is where the mid-term average price line, two separate retracement ratios, and the centre of the volatility band all overlap at once.
That overlap is why the buy zone sits there, and because 79 dollars is the level holding the rising-lows pattern together, the stop goes just below it at 78.9 dollars.
The full analysis is for members
Analysis by methodology (ICT, Wyckoff, Elliott, divergence, macro, news), invalidation levels, R:R and confidence are in the member report.