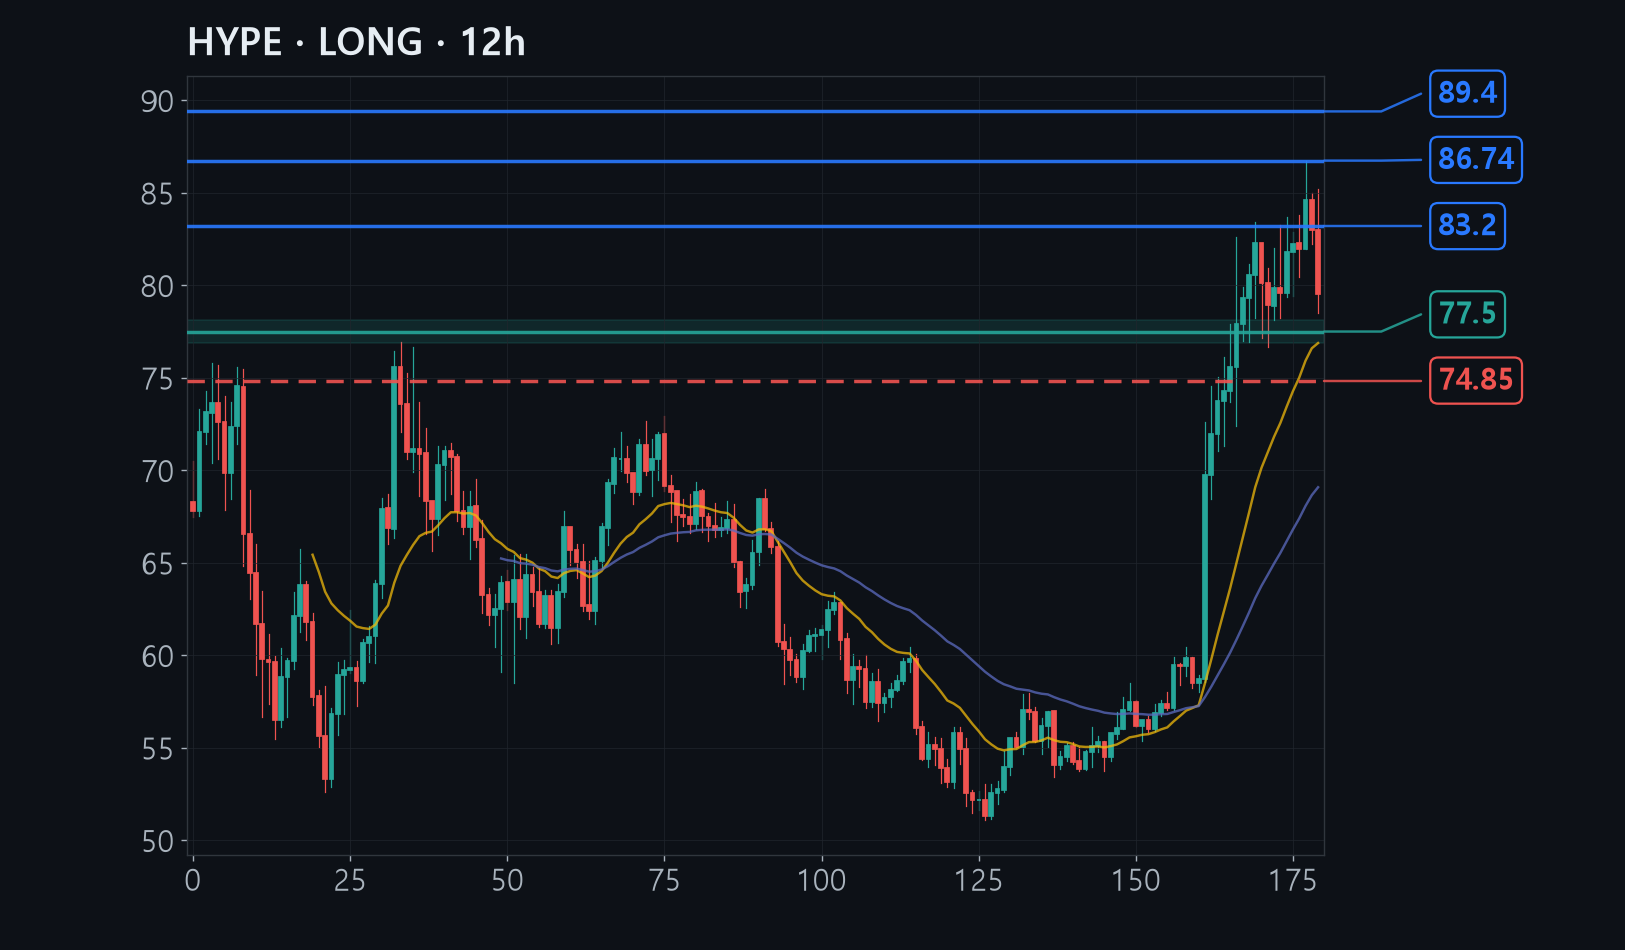
HYPE rallied 48% in a month, printed an all-time high of 86.74 on August 27, then gave it all back to 79.8 within a single day as the whole crypto market sold off.
The 76.9-78.1 area is where the 4-hour 50-period average and the 12-hour 20-period average overlap, and it also holds a floor that buyers have defended four separate times since August 24, so several supports stack up in one place.
Losing that area on a closing basis would break the last higher low at 76.69 that this uptrend is built on, which is exactly why the stop sits just beneath it at 74.85.
The full analysis is for members
Analysis by methodology (ICT, Wyckoff, Elliott, divergence, macro, news), invalidation levels, R:R and confidence are in the member report.