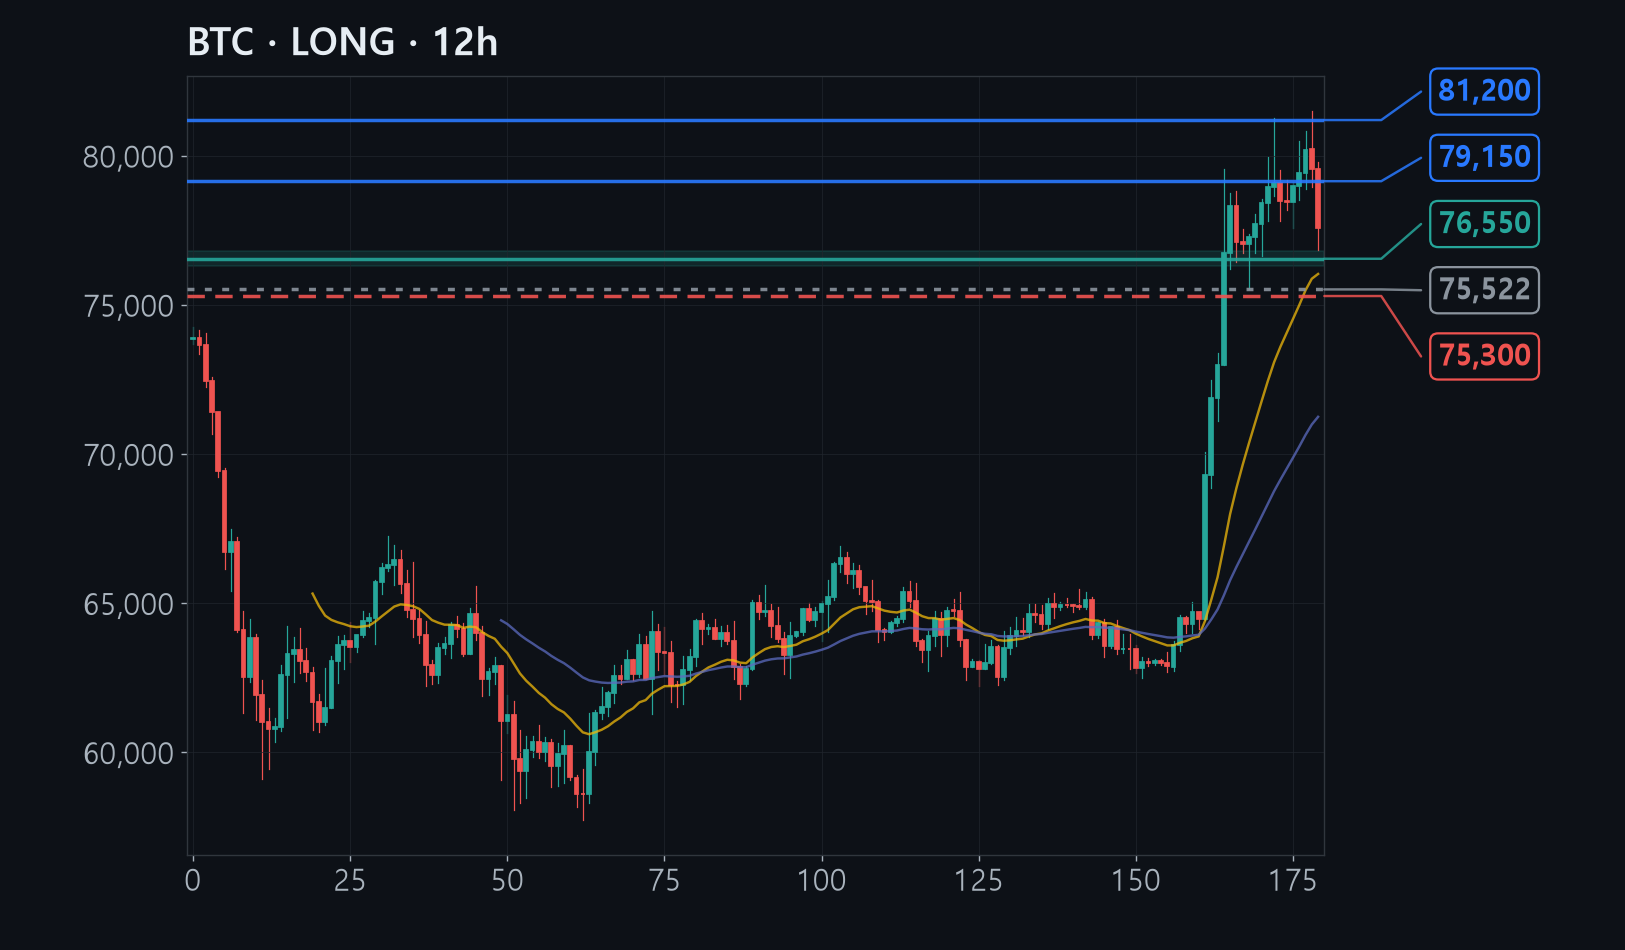
Bitcoin surged from 62,000 to 81,000 in just 20 days, and is now giving back part of that move, easing down into the 77,000s as the rally cools off.
The 76,300-76,800 band is where two recent bounces off the lows line up with the three-month average price line, and that overlap is why it was chosen as the buy zone.
If even that band gives way and price drops below the prior low at 75,500, the uptrend itself has broken, which is exactly why the stop sits just underneath it.
The full analysis is for members
Analysis by methodology (ICT, Wyckoff, Elliott, divergence, macro, news), invalidation levels, R:R and confidence are in the member report.