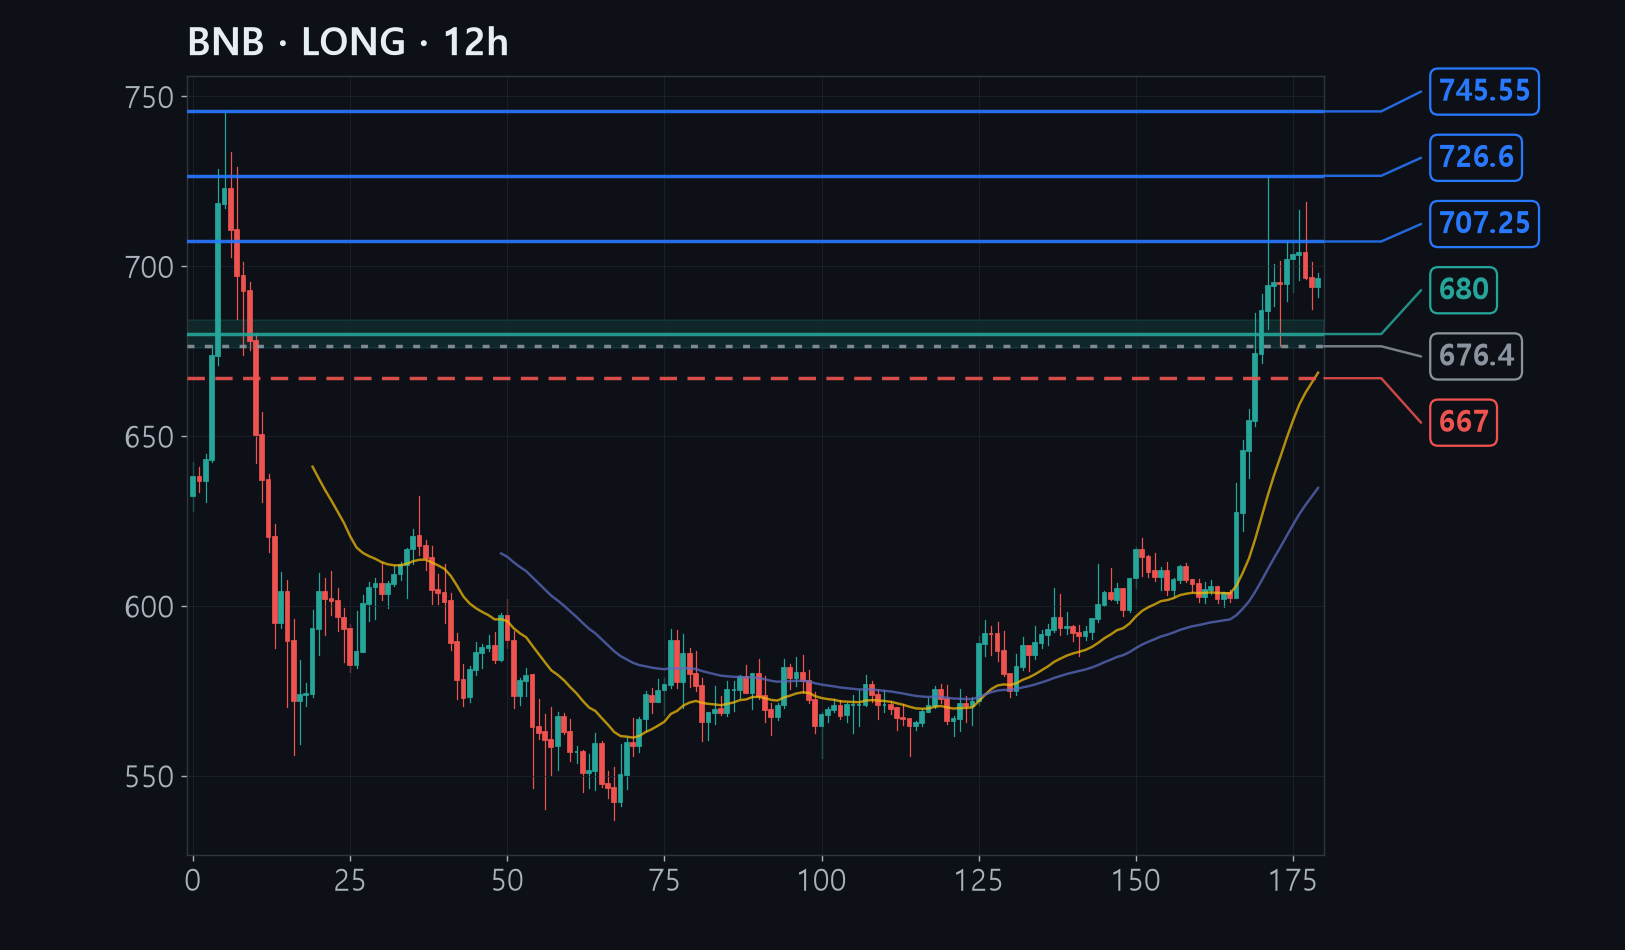
BNB surged from 600 to 726 in just five days and has since been moving sideways between 687 and 718, catching its breath after the run.
The 676-684 area stacks the five-day low together with the 38% give-back of the rally. Five of six analytical lenses independently pointed to this same band as the place to buy.
If 676 breaks on a 12-hour closing basis, the entire sideways structure fails. That is precisely why the stop sits just beneath it at 667.
The full analysis is for members
Analysis by methodology (ICT, Wyckoff, Elliott, divergence, macro, news), invalidation levels, R:R and confidence are in the member report.