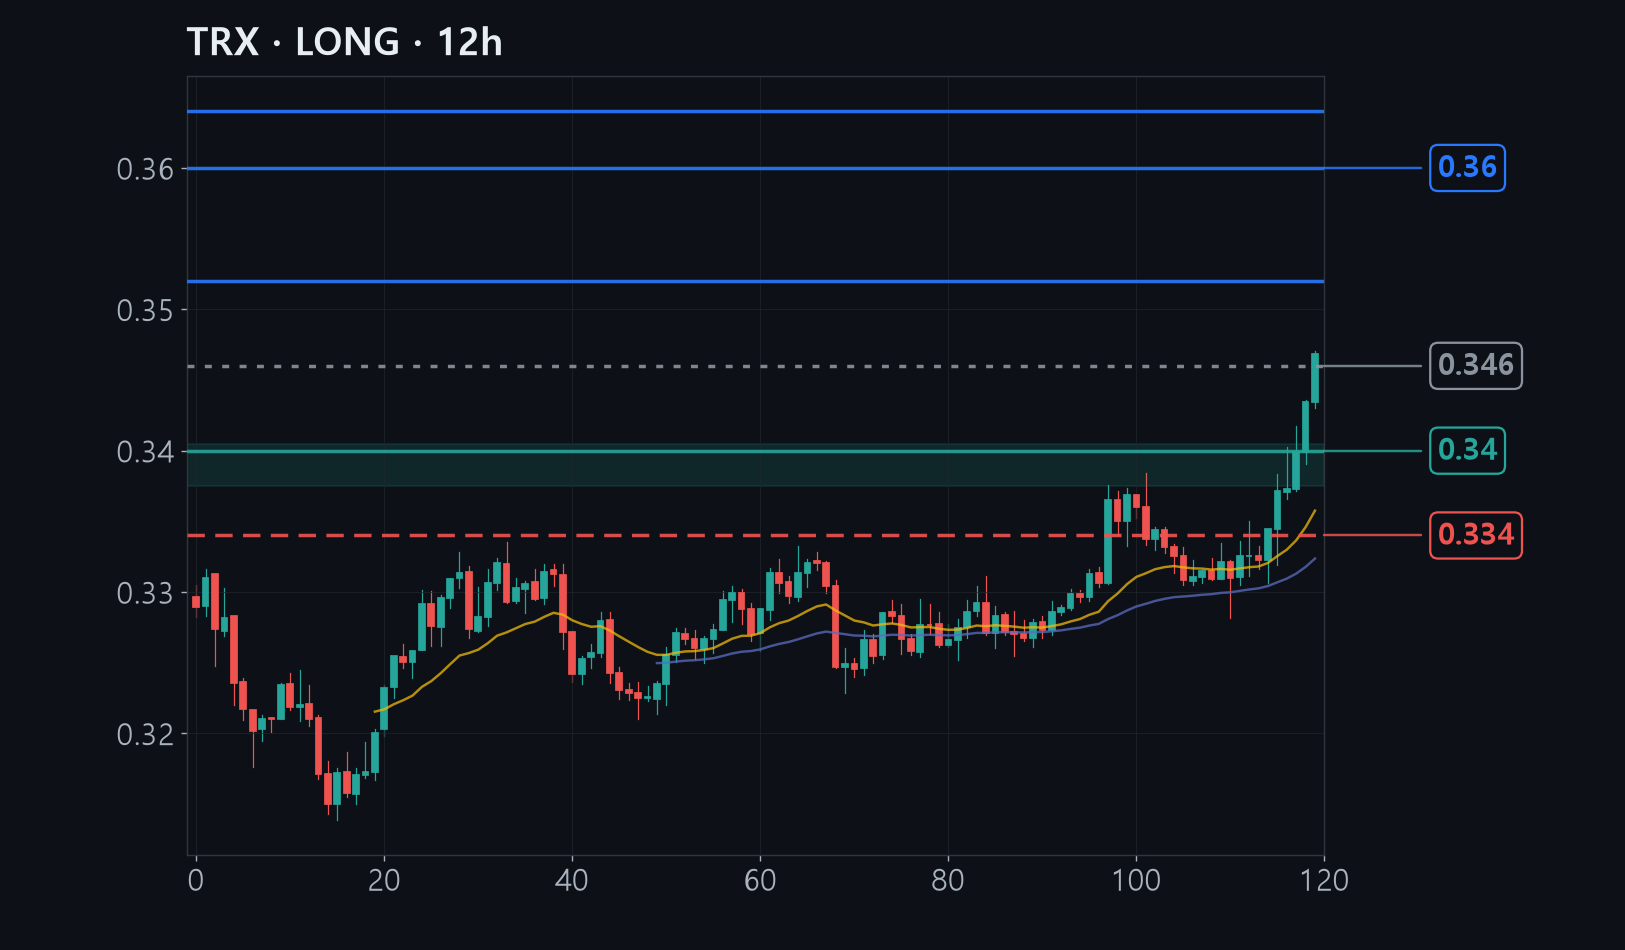
TRON was capped by a wall near 0.337 for over ten days, then two days ago volume exploded to nearly three times normal and price broke through, reaching 0.346.
The old 0.337-0.340 resistance now flips to support, and the 4-hour average price line plus the band where trading clustered after the breakout land on that exact same spot.
However, if 0.334 gives way, the entire two-day advance has been undone, so we treat the bullish logic as broken and place the stop-loss right there.
The full analysis is for members
Analysis by methodology (ICT, Wyckoff, Elliott, divergence, macro, news), invalidation levels, R:R and confidence are in the member report.