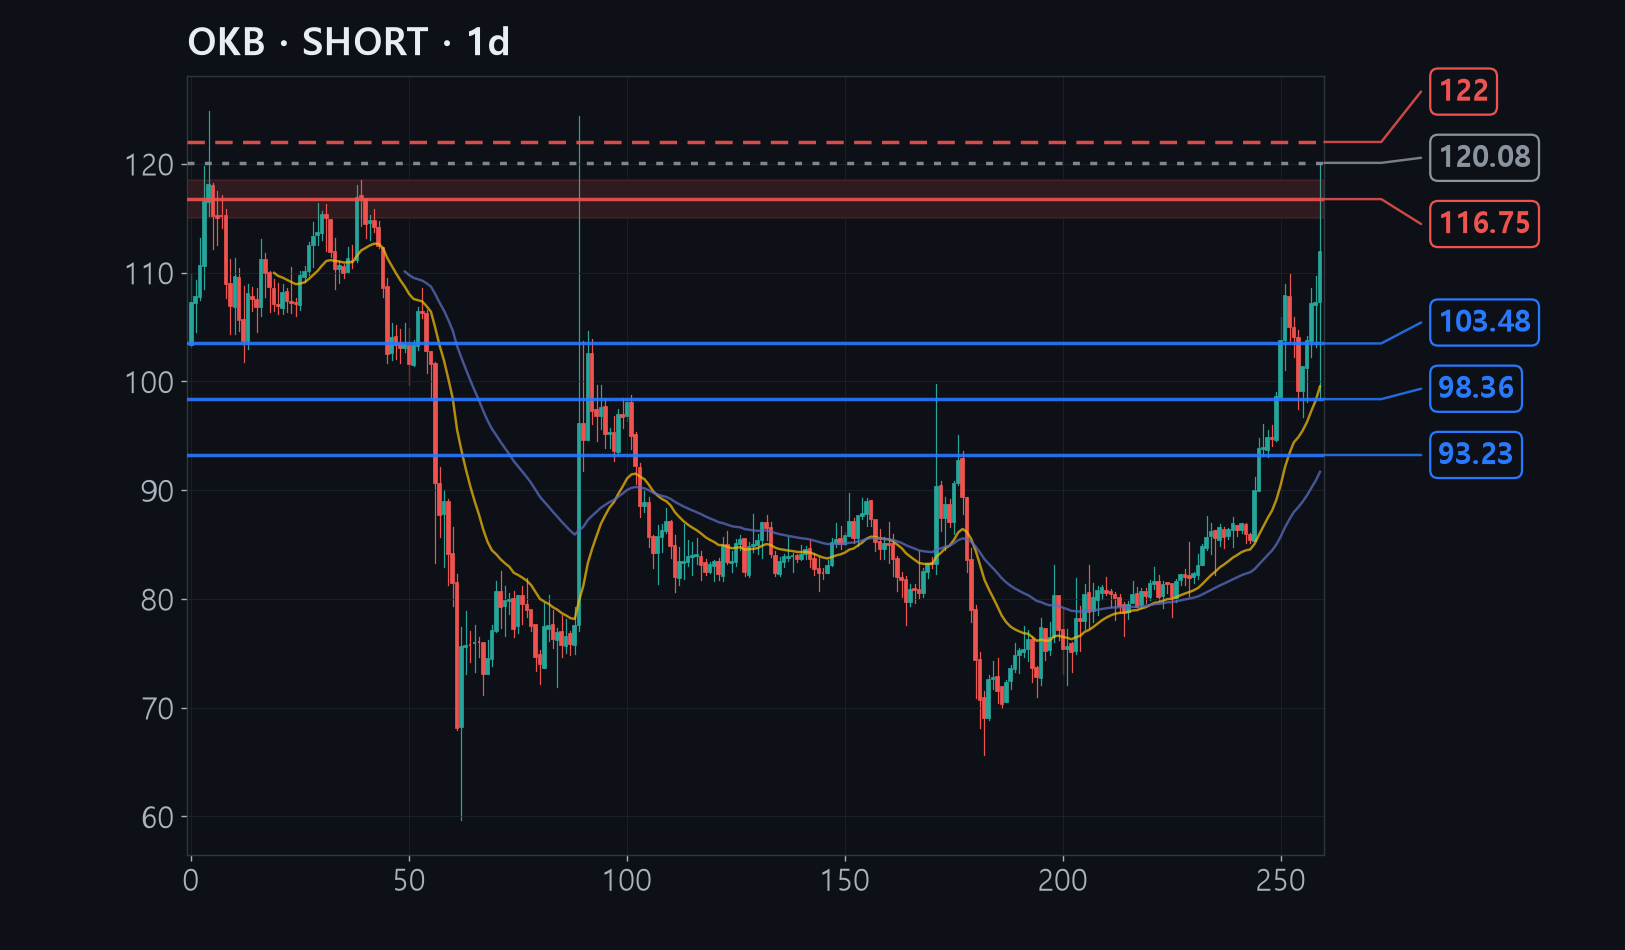
OKB climbed from $76 to $120 over the past three months, but in a single day today it tagged $120, collapsed to $98, and then recovered back to $111.
Price pushed above the previous peak while the force behind the rally actually weakened, and volume 2.5 times the norm erupted at that very peak - signs of exhausted buying stacking at one price.
The stop therefore sits just above today's $120 high. If the day closes above it, this bearish view is simply wrong and the advance should be treated as continuing.
The full analysis is for members
Analysis by methodology (ICT, Wyckoff, Elliott, divergence, macro, news), invalidation levels, R:R and confidence are in the member report.