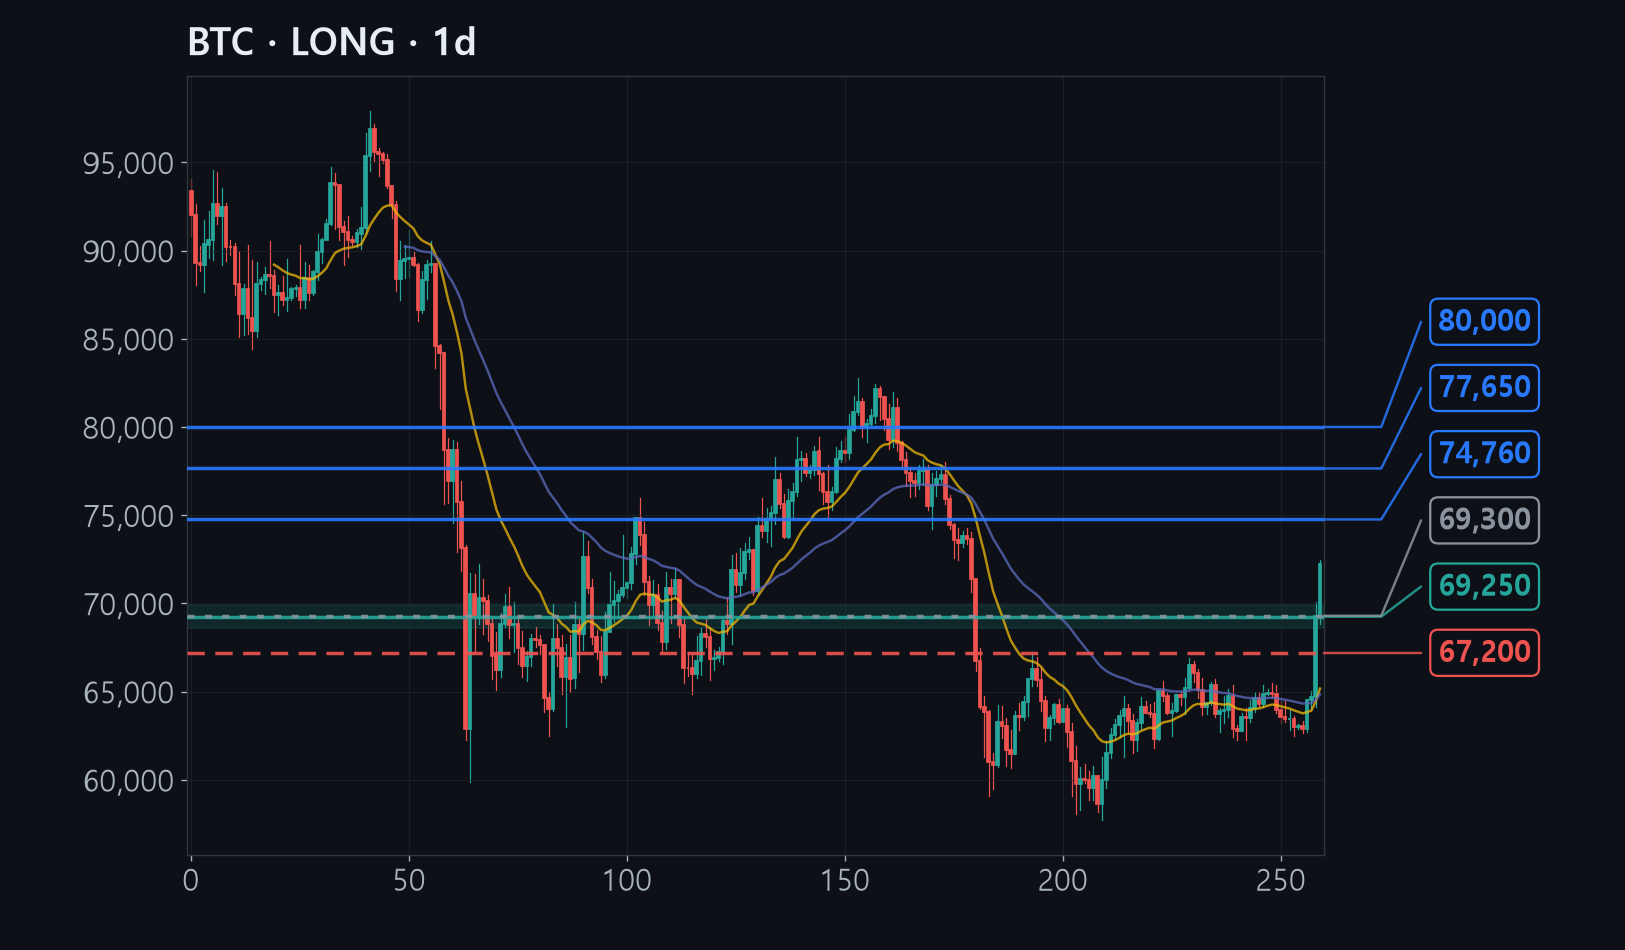
Bitcoin broke out of the $62,000-$65,000 box that had contained it for six weeks, surging 11% to $72,000 in just two days on volume two to three times normal.
All six of our analysis frameworks pointed higher, and three separate signals - the one-year average price line, the level where the surge began, and the standard pullback zone - overlap near $69,000, which is why we chose that spot to buy.
If $67,200 gives way, it means the breakout was a trap, so the stop sits just below it and the plan switches to a return into the old range.
The full analysis is for members
Analysis by methodology (ICT, Wyckoff, Elliott, divergence, macro, news), invalidation levels, R:R and confidence are in the member report.