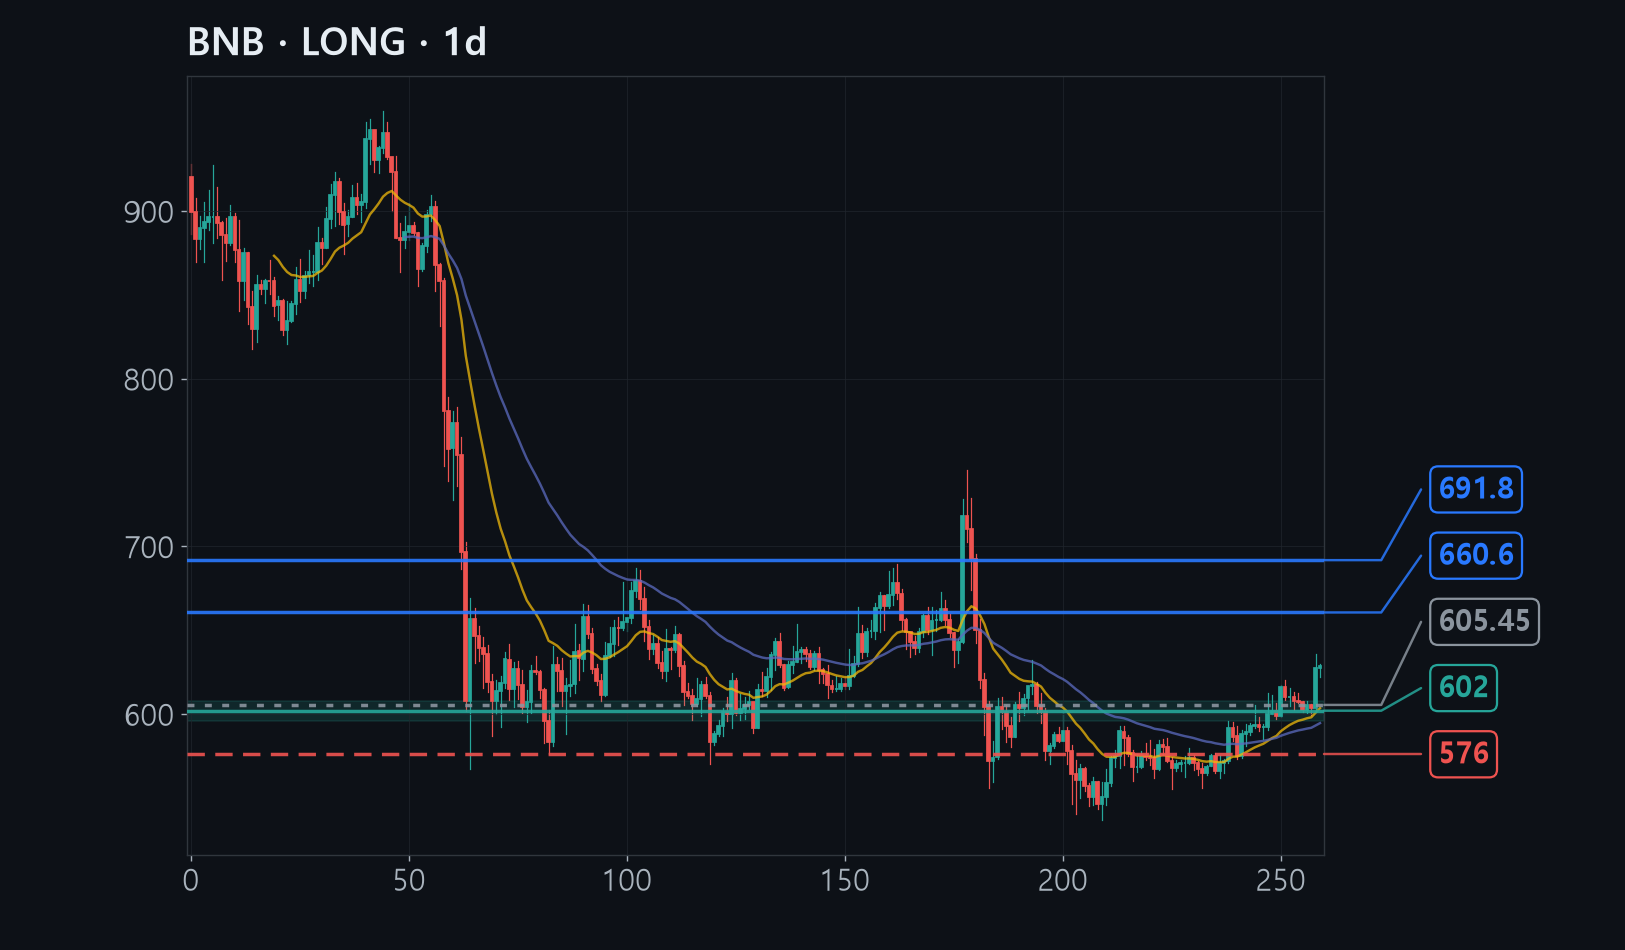
BNB has been carving out higher lows since bottoming near $546, and on August 19 it surged to $636 on double its usual volume before settling back to catch its breath around $626.
Five of six analytical lenses point higher, and the $596-608 zone is where the one-month average price line, the launch point of that surge, and the level pullbacks typically stall all overlap at once.
If $576 gives way, however, the entire sequence of rising lows breaks down, so the stop sits just beneath it as the point where we admit the call was simply wrong.
The full analysis is for members
Analysis by methodology (ICT, Wyckoff, Elliott, divergence, macro, news), invalidation levels, R:R and confidence are in the member report.