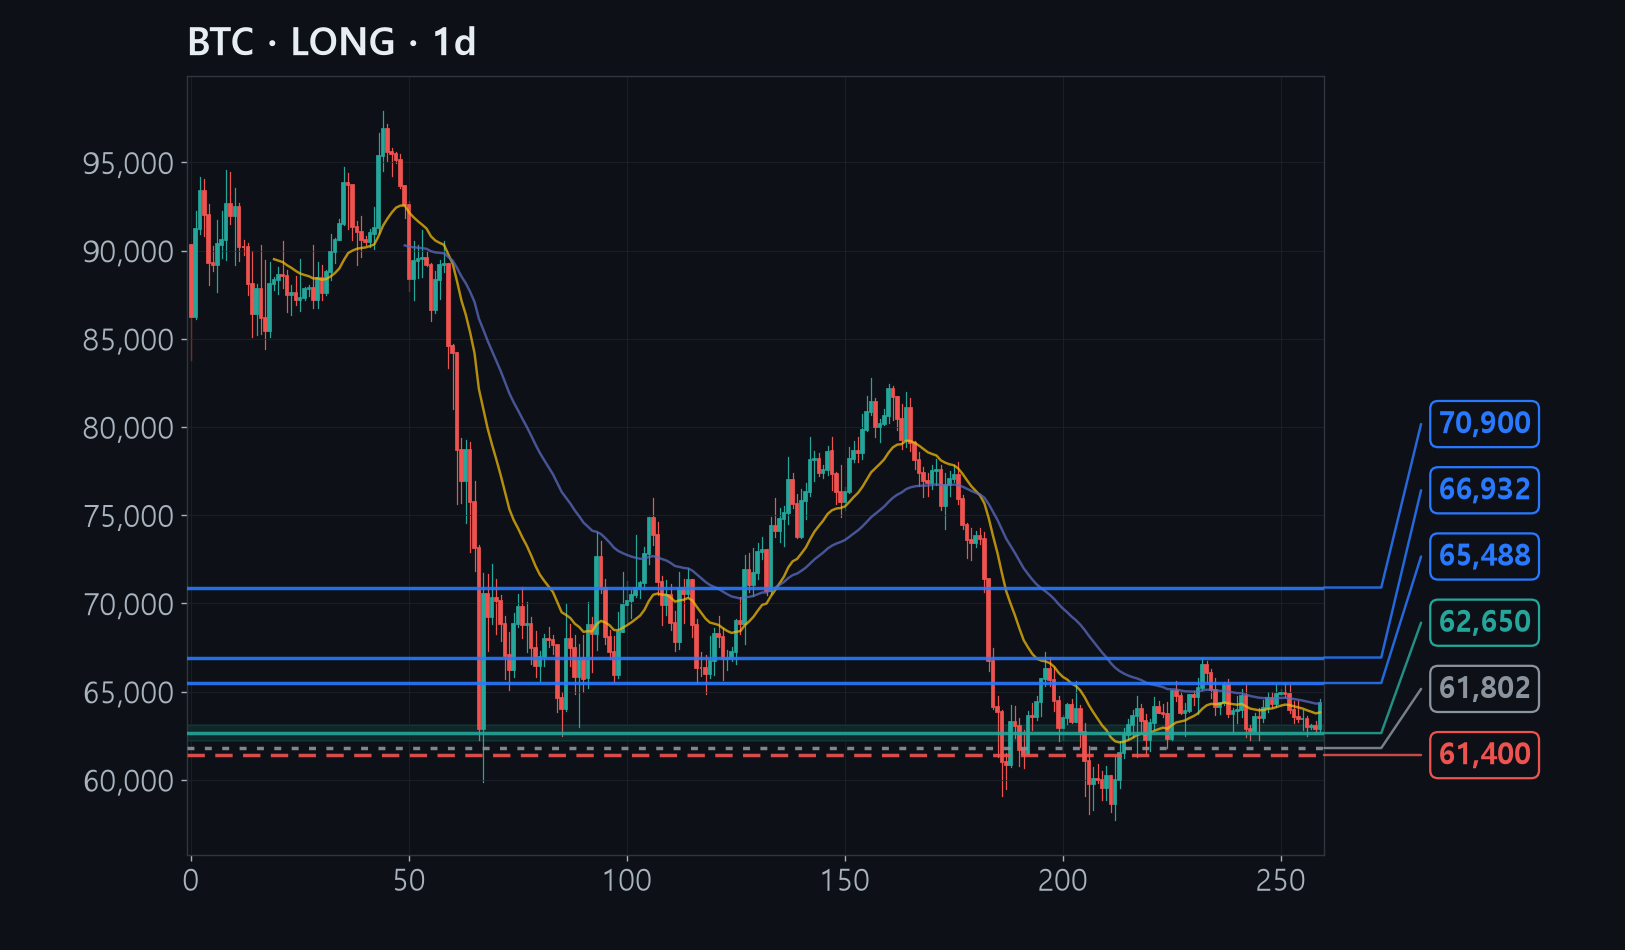
Bitcoin bottomed near 57,700 and has since raised its low four times in a row, narrowing its swing range into a 62,000 to 66,900 band.
Four of six frameworks point higher, and exhausted selling at the low, the rising support line and the pullback zone all stack into the same 62,200 to 63,100 pocket.
If the 61,800 level breaks on a daily close, the entire sequence of rising lows collapses, which is exactly why the stop is placed just beneath it.
The full analysis is for members
Analysis by methodology (ICT, Wyckoff, Elliott, divergence, macro, news), invalidation levels, R:R and confidence are in the member report.