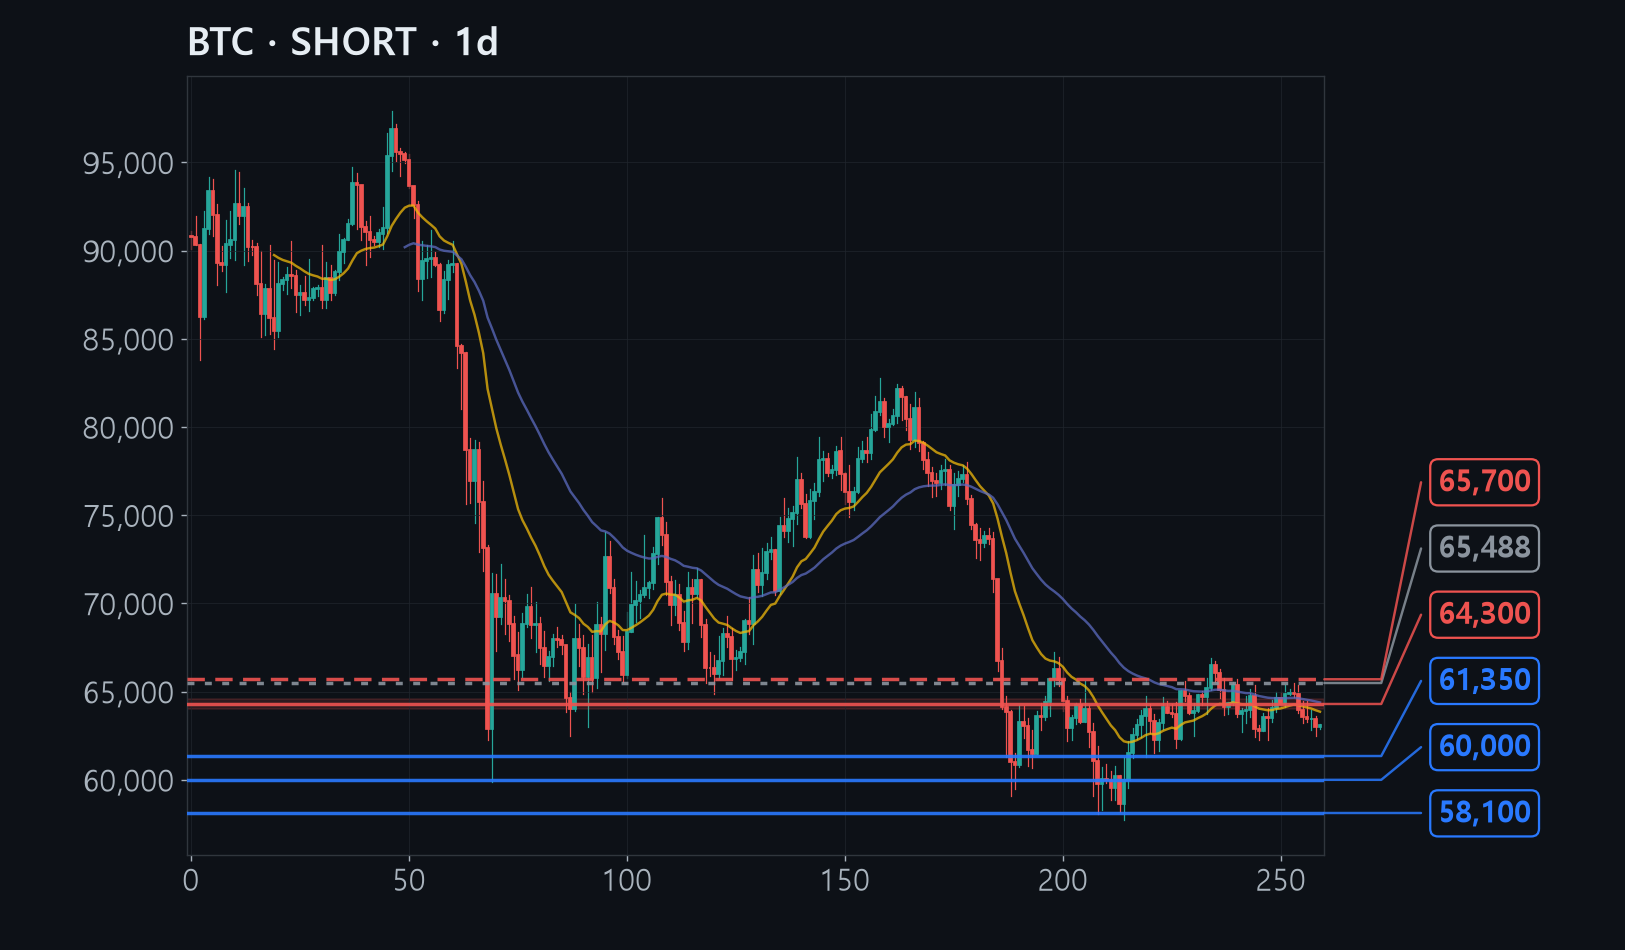
Bitcoin has been boxed into the 57,700-67,000 range for six months, and each bounce is peaking lower than the last - 66,900, then 65,500.
Near 64,000 the 20-day and 50-day average price lines overlap with the halfway retracement of the last drop, stacking several resistances into one narrow band - that is why the sell is placed there.
A daily close above the prior bounce high of 65,500 would break the pattern of lower peaks, so the stop sits just above it at 65,700.
The full analysis is for members
Analysis by methodology (ICT, Wyckoff, Elliott, divergence, macro, news), invalidation levels, R:R and confidence are in the member report.