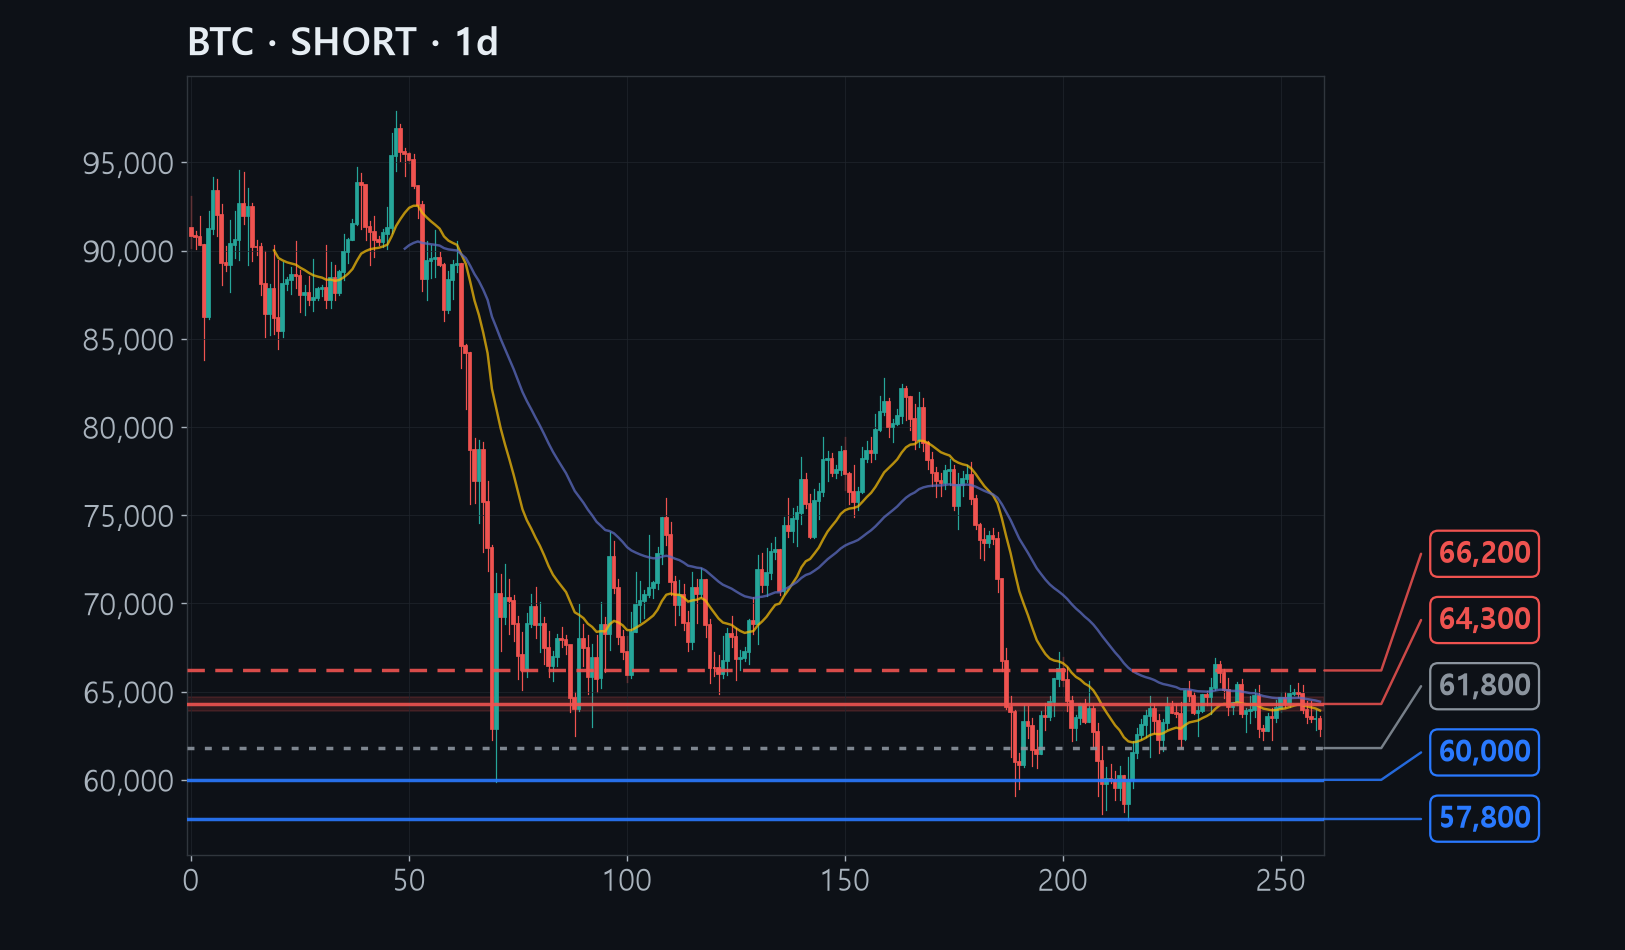
Bitcoin has slid from its $66,900 high down to the low $62,800s and now trades below both its 20-day and 50-day average price lines.
Four of our six analysis methods point lower, and the 20-day line, the 50-day line and the halfway retracement of this decline all stack up in the same $63,900-$64,700 band.
A daily close above $66,200 would break the pattern of steadily lower highs that this trade rests on, which is exactly why the stop-loss sits just above that level.
The full analysis is for members
Analysis by methodology (ICT, Wyckoff, Elliott, divergence, macro, news), invalidation levels, R:R and confidence are in the member report.