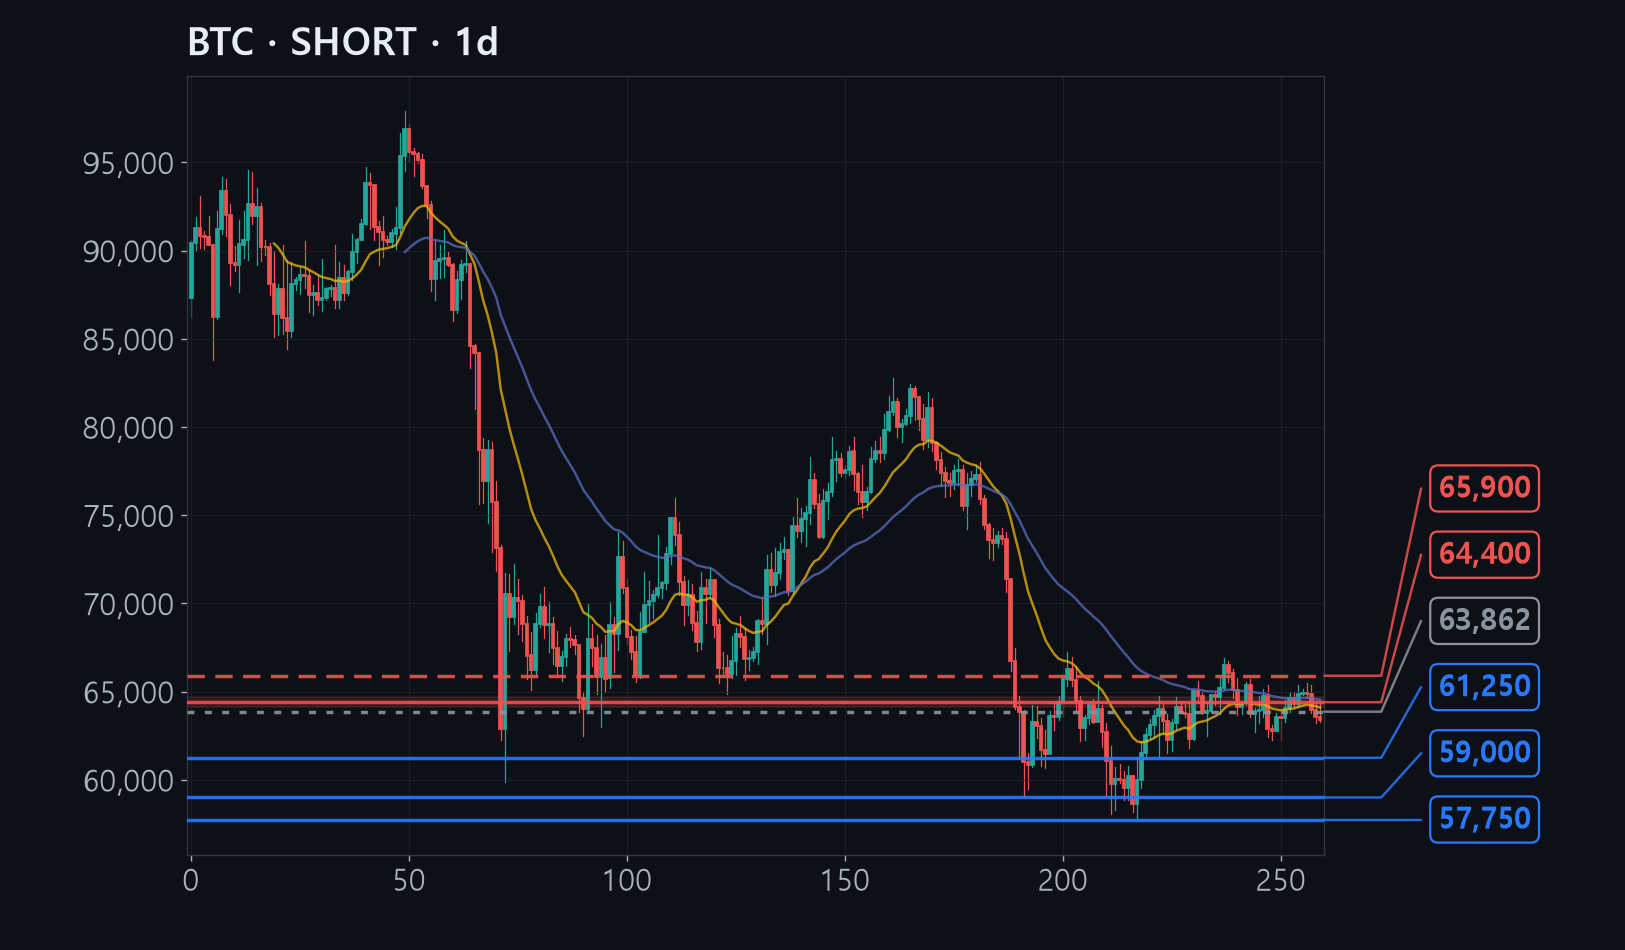
Bitcoin stalled at 65,000 dollars and has fallen three days running to 63,400, near the bottom of its two-month trading range.
At the last high price rose while the force behind it faded, and the 20-day and 50-day average lines plus the selloff's price gap overlap at 64,100-64,700.
A bounce into that band is the place to sell, with the stop at 65,900 above the recent high, since a daily close over it would mean this read is wrong.
The full analysis is for members
Analysis by methodology (ICT, Wyckoff, Elliott, divergence, macro, news), invalidation levels, R:R and confidence are in the member report.