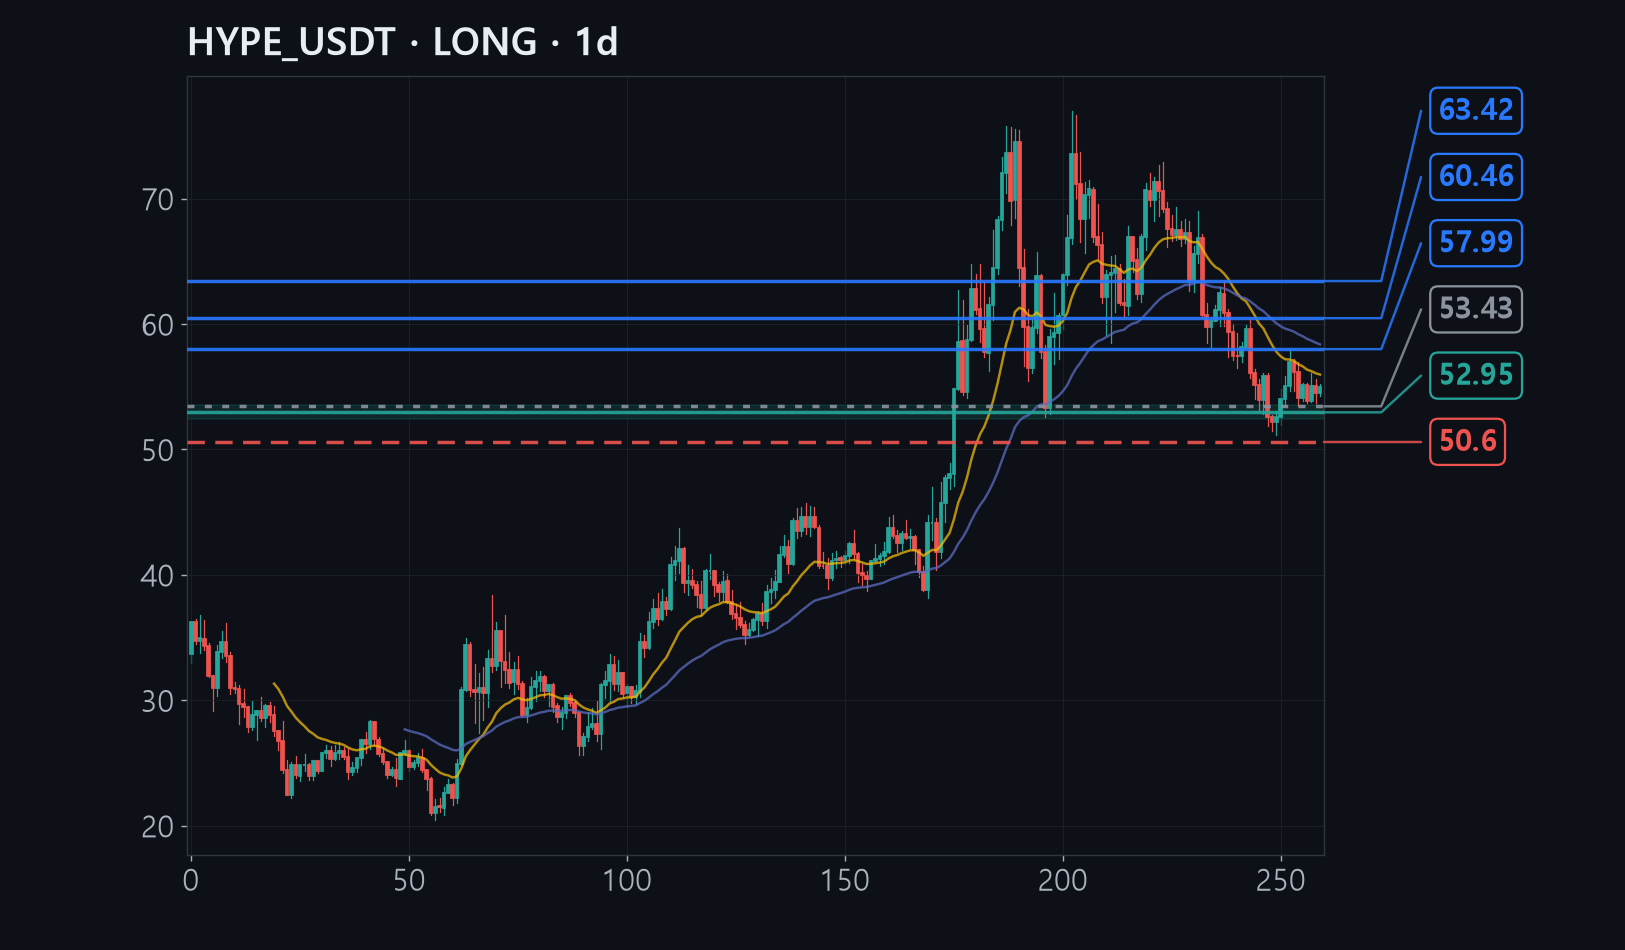
HYPE slid from $72.9 to $51.1 and has spent the past two months grinding sideways, boxed roughly between $51 and $58 while it builds a base.
Sellers ran dry at $51.1, every dip since has bottomed a little higher, and selling pressure has eased for 20 straight days - all three overlap at $52-53.5.
A daily close under $50.6 would mean the base has failed, so the stop sits exactly there, and the first target is the $58 ceiling of the range.
The full analysis is for members
Analysis by methodology (ICT, Wyckoff, Elliott, divergence, macro, news), invalidation levels, R:R and confidence are in the member report.