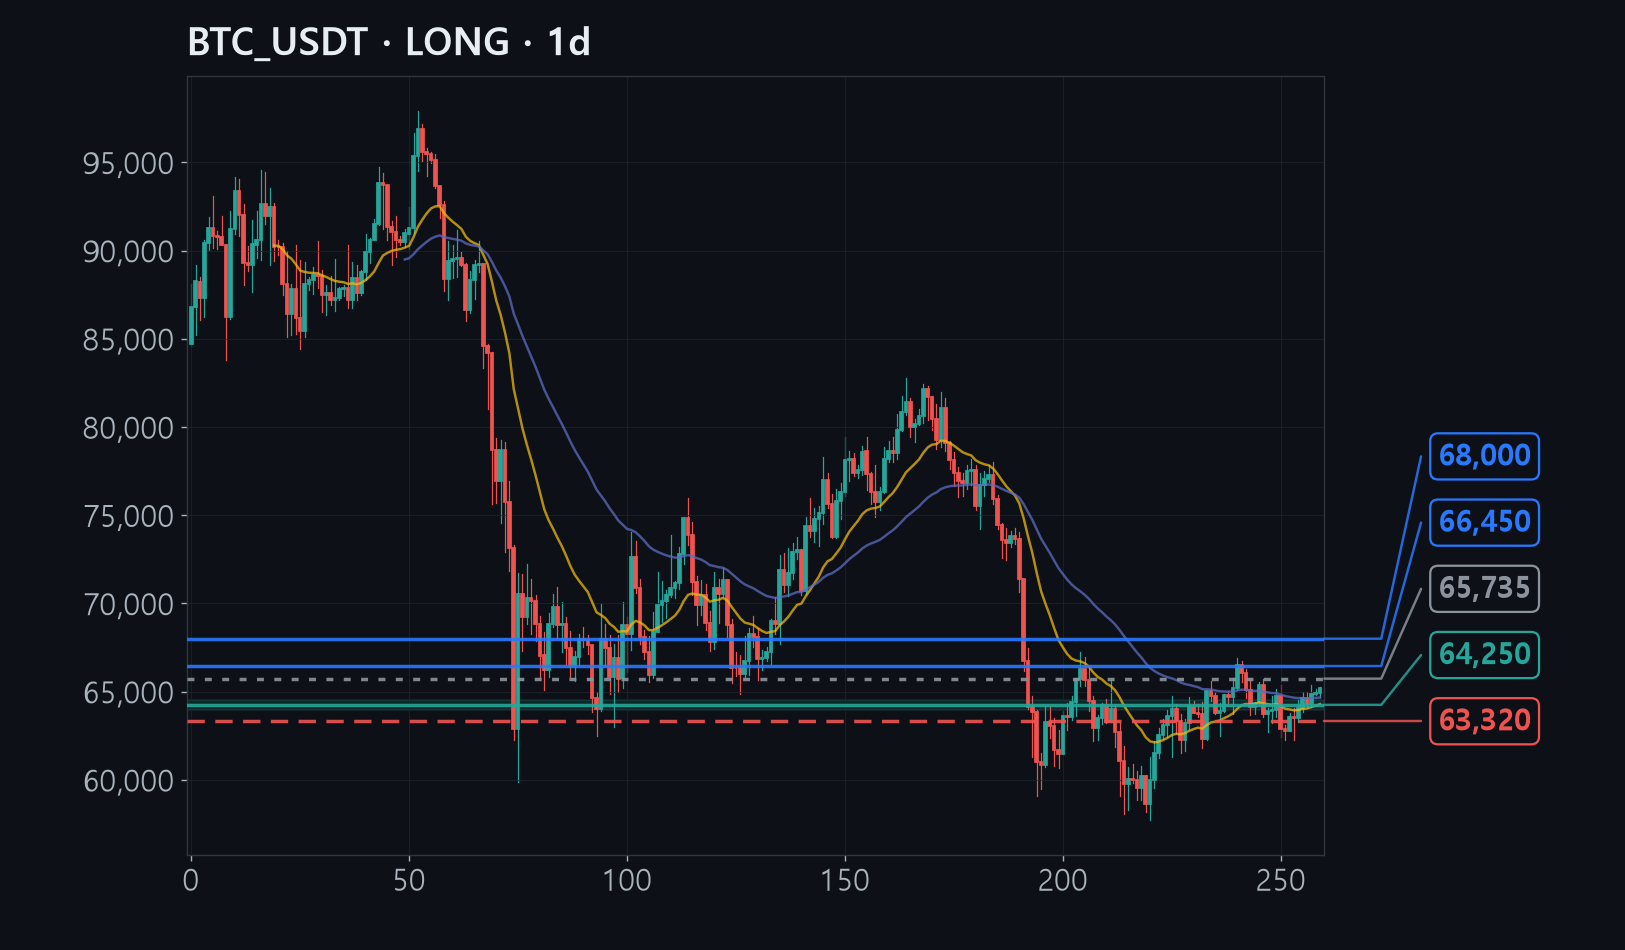
Bitcoin bottomed at $57,746 and has rebounded to $65,175, lifting its low three times in a row - a recovery that is real but not yet fully confirmed.
On the 12-hour chart the moving-average crossover, the buy zone where the latest rally began, and the level where pullbacks typically stall all overlap near $64,000.
A break of $63,320 would snap the chain of rising lows that supports this whole idea, which is exactly why the stop sits just below it.
The full analysis is for members
Analysis by methodology (ICT, Wyckoff, Elliott, divergence, macro, news), invalidation levels, R:R and confidence are in the member report.