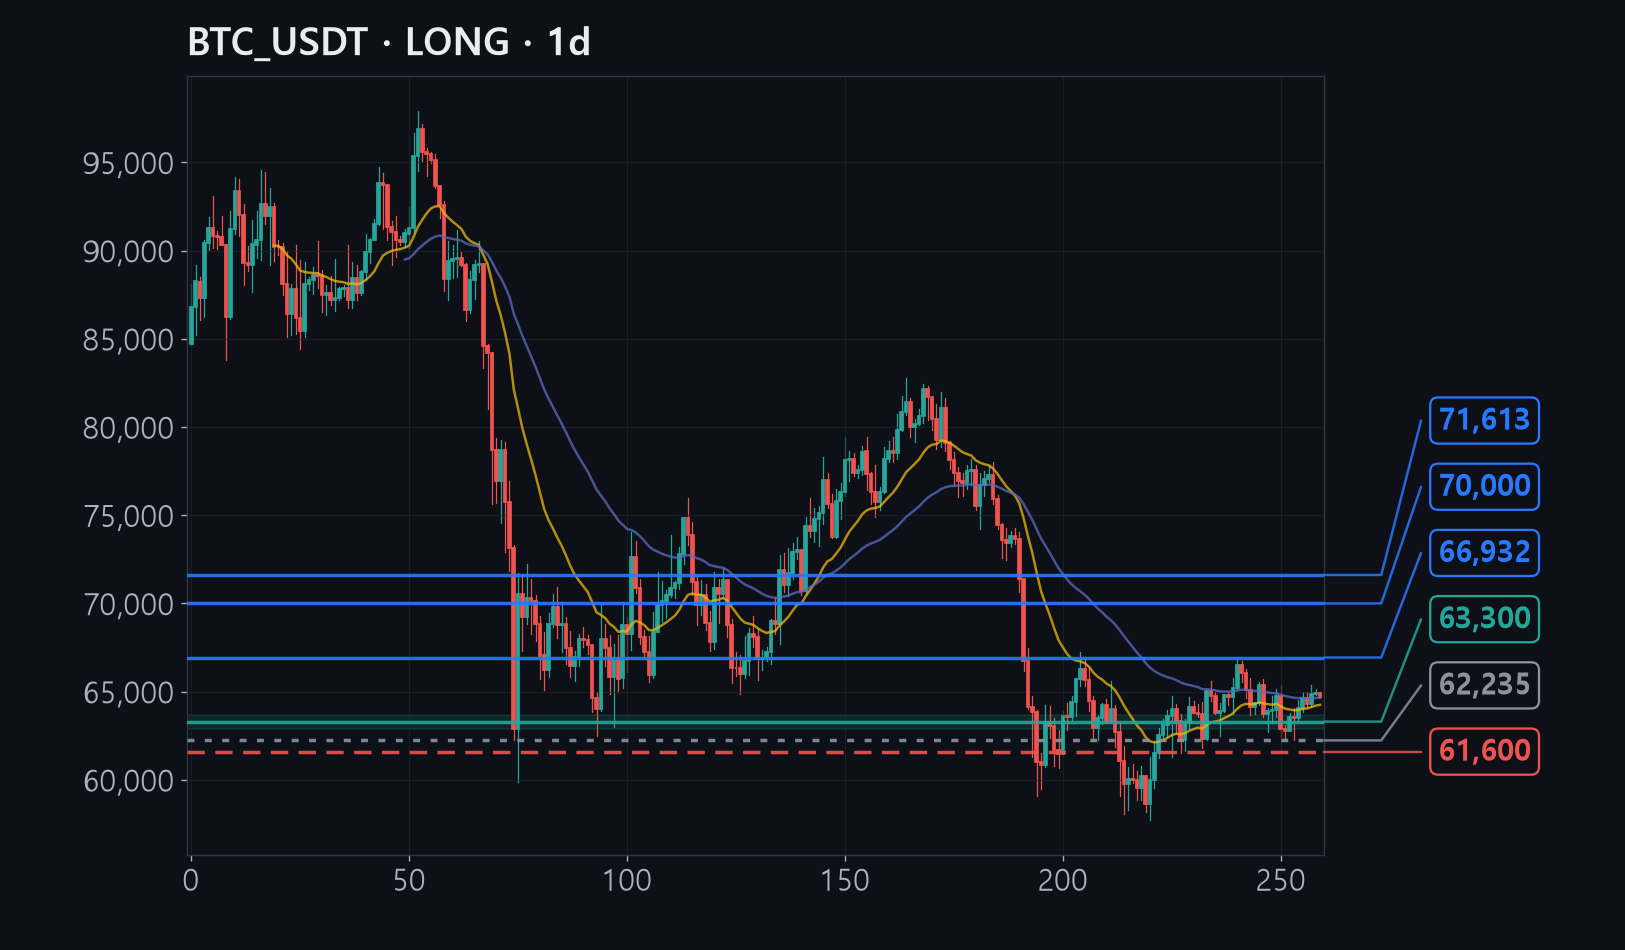
Bitcoin bottomed near 57,700 dollars and has recovered to the 64,000 area, but it still trades below its one-year average price line, so this is a recovery inside a larger correction rather than a new uptrend.
Three things line up in the 62,900-63,700 zone: lows that keep stepping higher, heavy selling that failed to push price down, and miners capitulating - a combination that has marked past bottoms.
A daily close below 61,600 would break the pattern of rising lows entirely, which is exactly why the stop sits just underneath that level rather than anywhere closer.
The full analysis is for members
Analysis by methodology (ICT, Wyckoff, Elliott, divergence, macro, news), invalidation levels, R:R and confidence are in the member report.