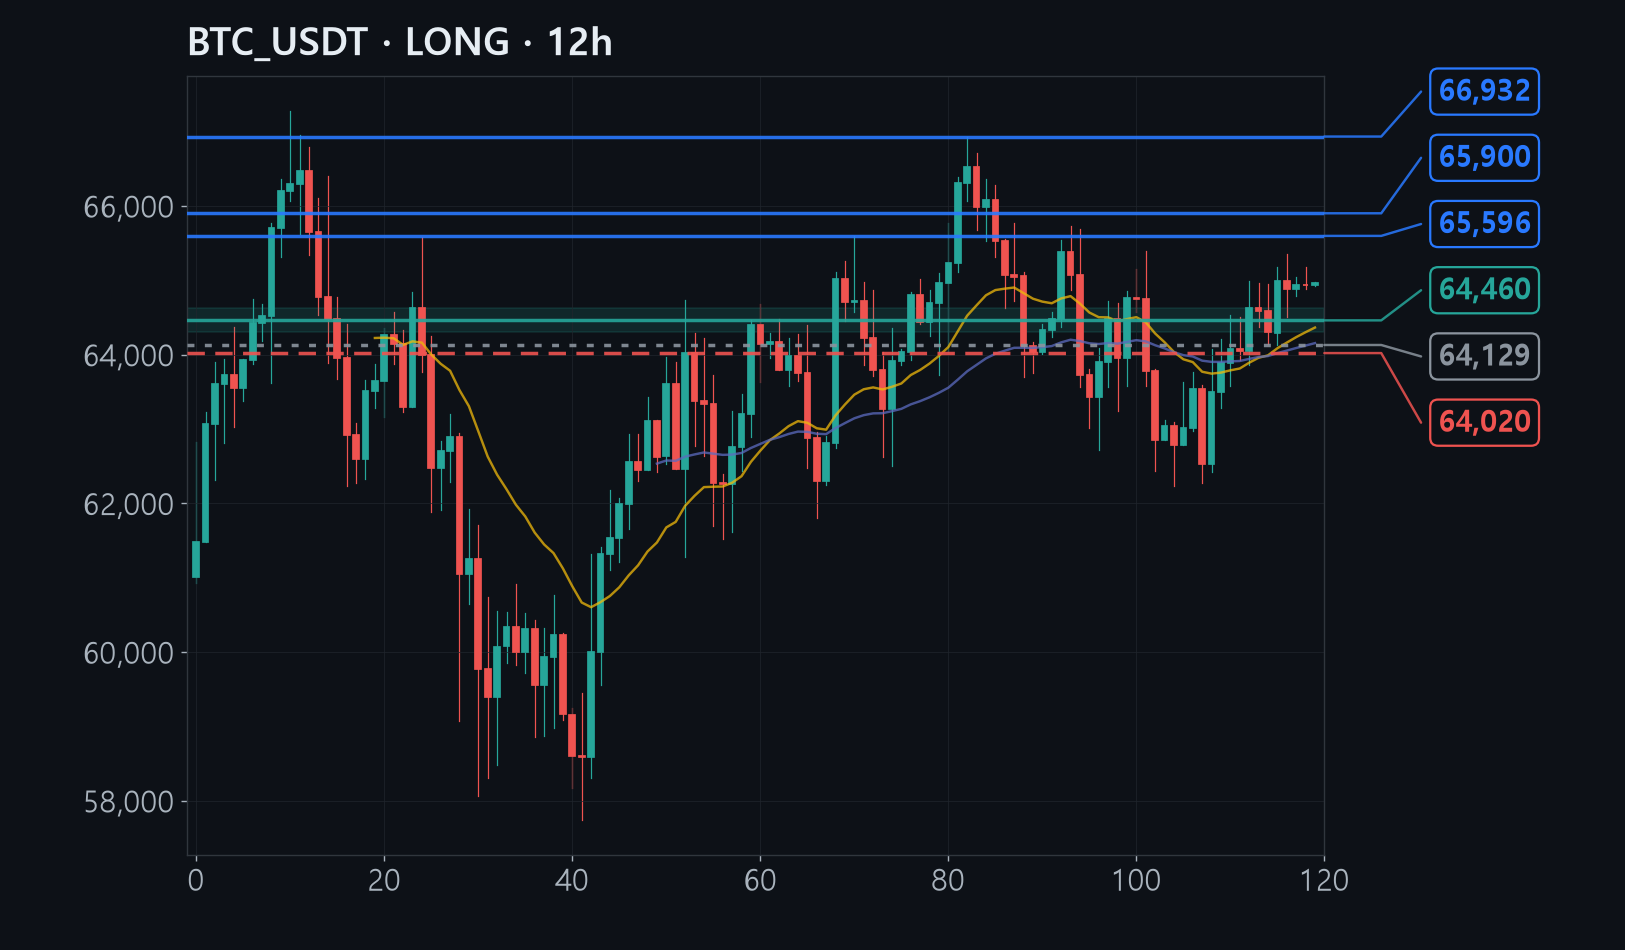
Bitcoin double-bottomed near $62,200, rallied to $65,300, and is now easing back to give some of that move up while it rests.
$64,300-64,620 is where several signals overlap: the two-month average price line, the bottom of the gap left by the last surge, and a shelf where selling was absorbed.
The most recent higher low sits at $64,128; losing it would break the step-by-step rising pattern, so the stop is placed just underneath at $64,020.
The full analysis is for members
Analysis by methodology (ICT, Wyckoff, Elliott, divergence, macro, news), invalidation levels, R:R and confidence are in the member report.