BULLISH
BNB BULLISH · 1d
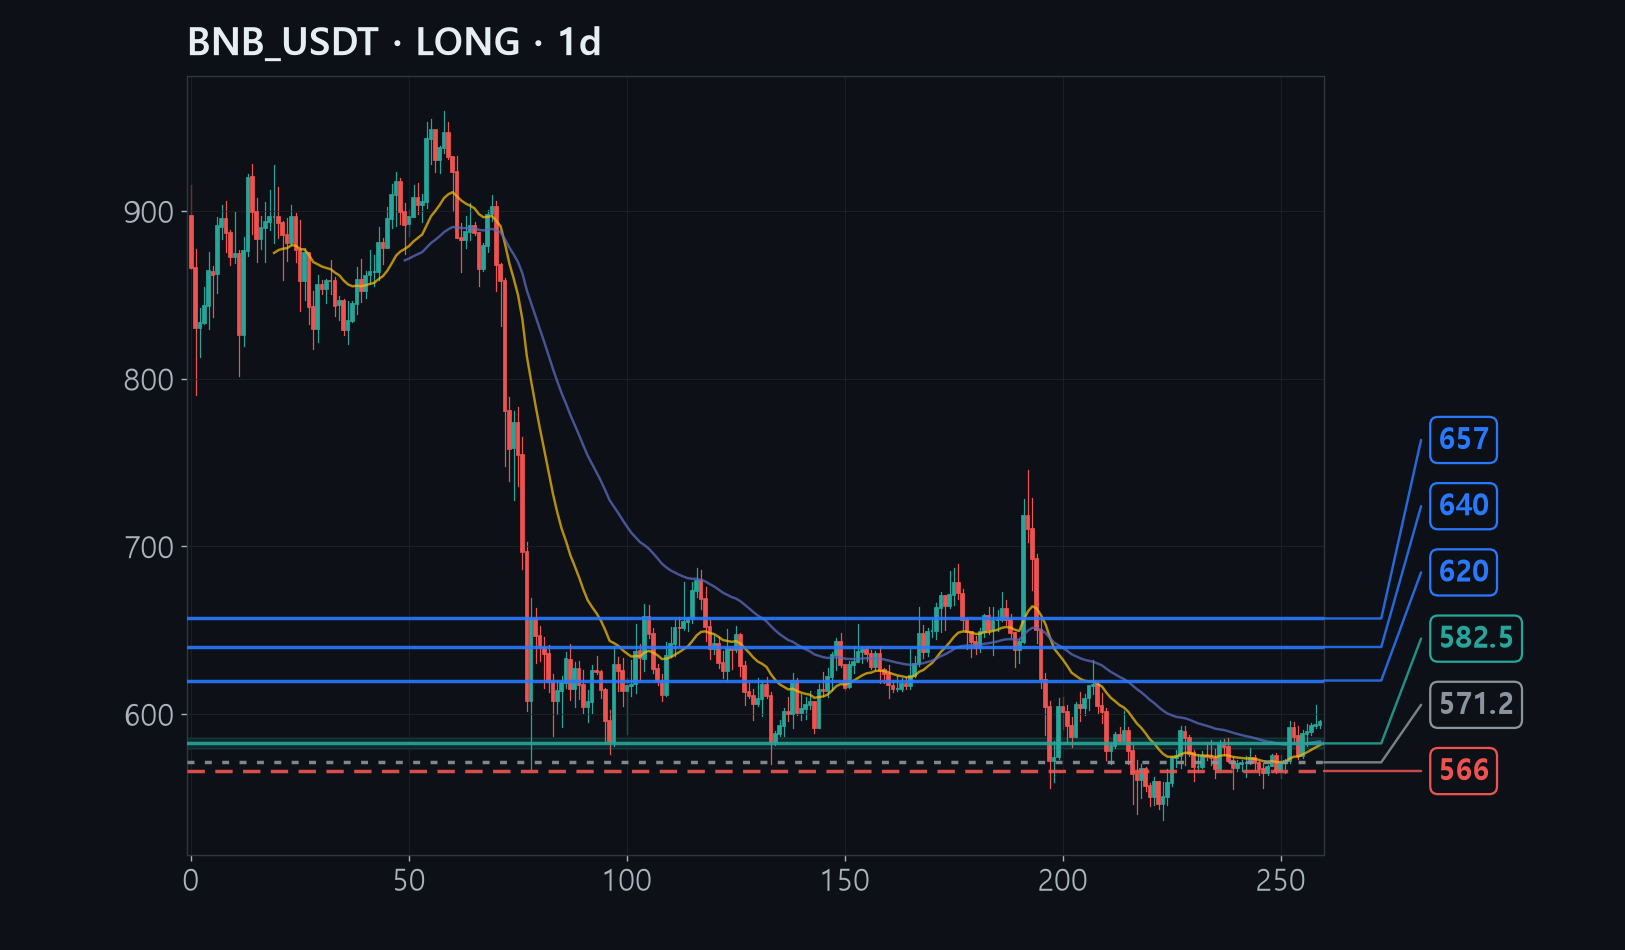
ENTRY579~586TARGET620STOP566
In 3 lines
- BNB climbed steadily from a $537 floor up to $605, and is now pausing after running into resistance at the 605 line.
- At $579-586 the one-month and two-month average price lines converge with the buying zone where the last big rally began.
- A daily close below $566 would mean giving back both that buying zone and half the rally, so that is where the trade is cut.
The full analysis is for members
Analysis by methodology (ICT, Wyckoff, Elliott, divergence, macro, news), invalidation levels, R:R and confidence are in the member report.
See how to join →