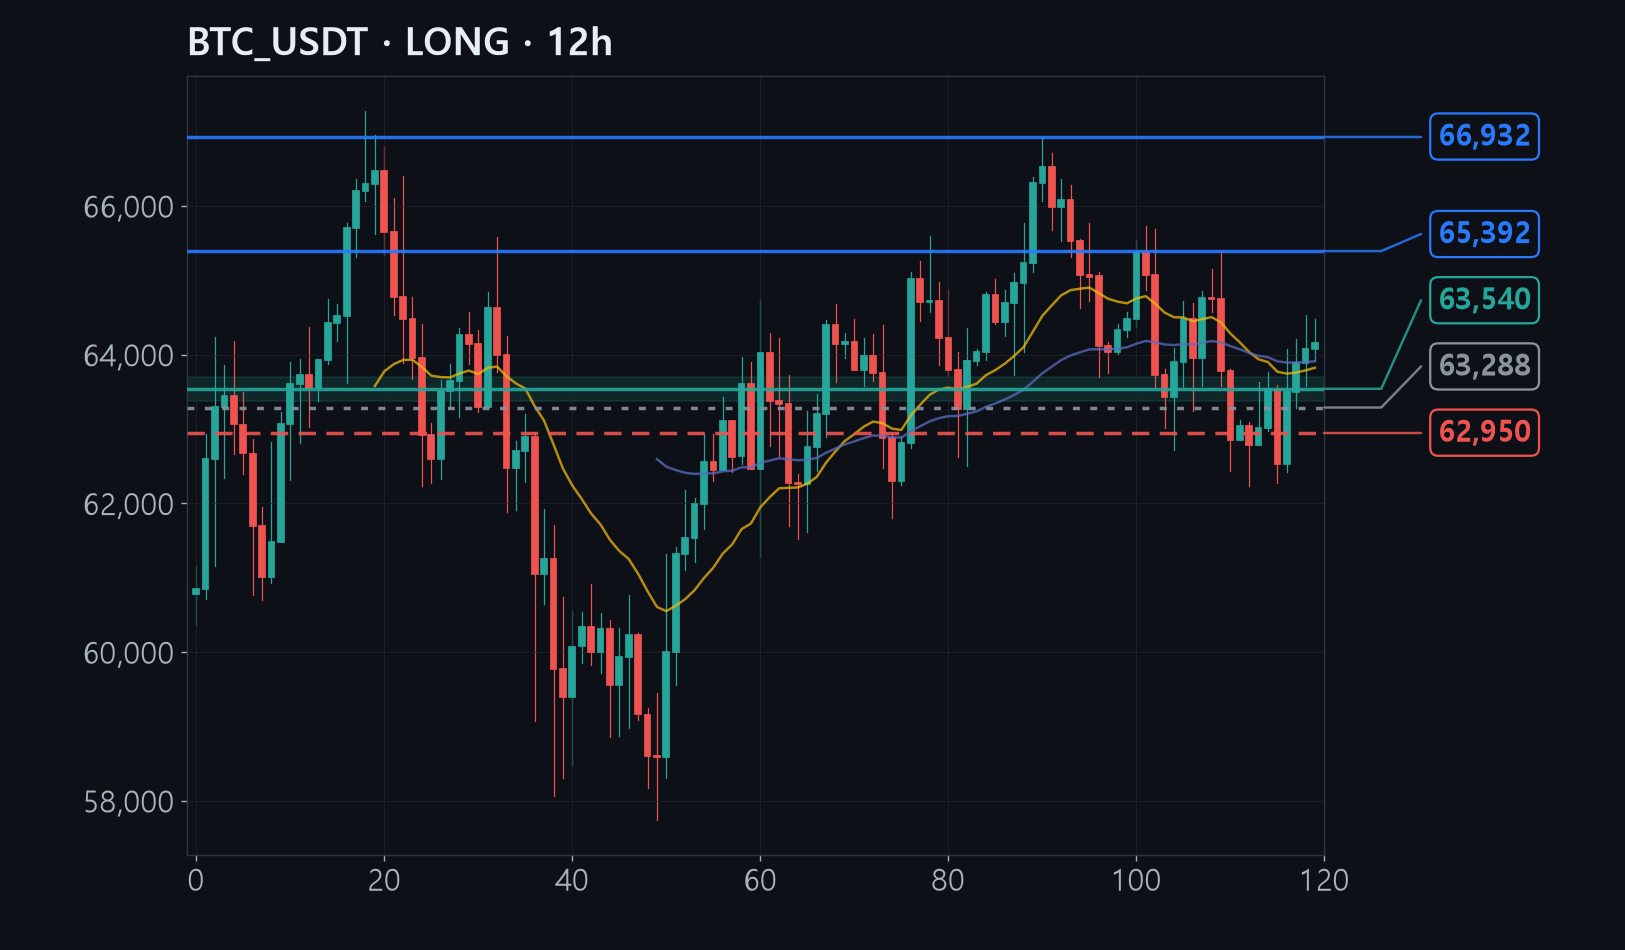
Bitcoin bounced from its 62,235 low to 64,111 and sits just above 63,600, where its 20-, 50- and 200-period average lines have bunched together.
Three signals overlap here: a lower low made as selling pressure weakened, a bounce on surging volume, and all three average lines sitting at 63,400-63,700.
Buying here pays too little for the risk, so orders wait at 63,380-63,700; a break of 63,288 means the rebound failed, putting the stop at 62,950.
The full analysis is for members
Analysis by methodology (ICT, Wyckoff, Elliott, divergence, macro, news), invalidation levels, R:R and confidence are in the member report.