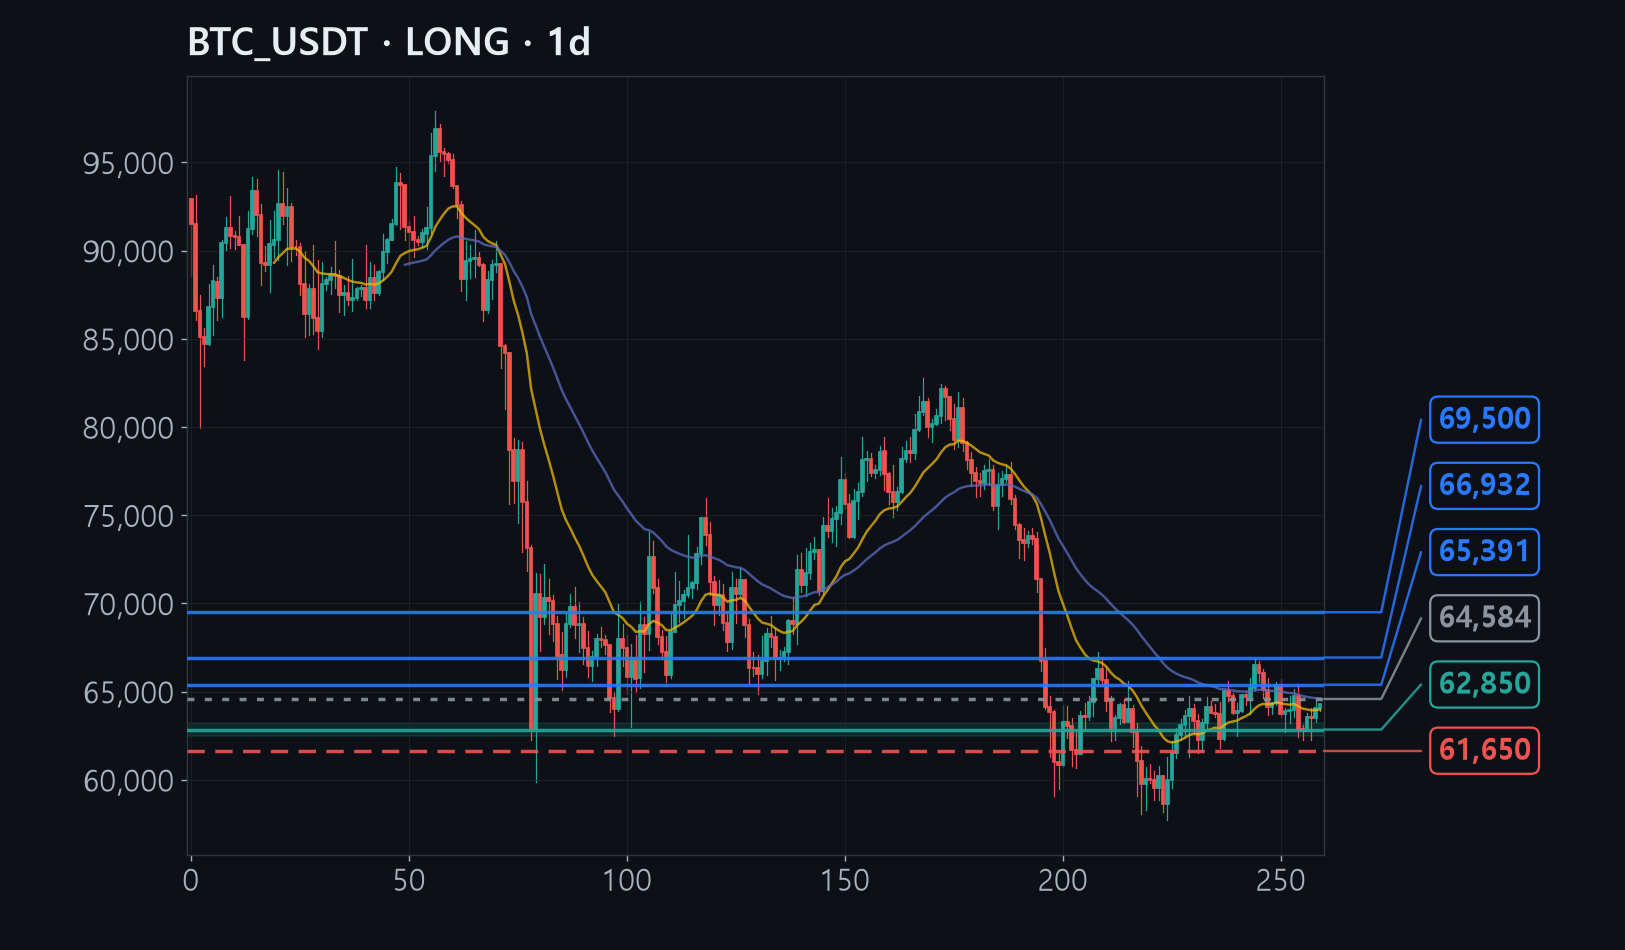
Bitcoin has bounced twice off the 62,200 area and held that floor, and is now hovering near 64,000 while it decides which way to break next.
Four of six frameworks point higher, and it is the overlap that matters: selling dried up at the low and downward pressure is fading, both at 62,500 to 63,200.
If 62,200 gives way on a daily closing basis, the rebound case collapses, which is exactly why the stop is placed just beneath it at 61,650.
The full analysis is for members
Analysis by methodology (ICT, Wyckoff, Elliott, divergence, macro, news), invalidation levels, R:R and confidence are in the member report.