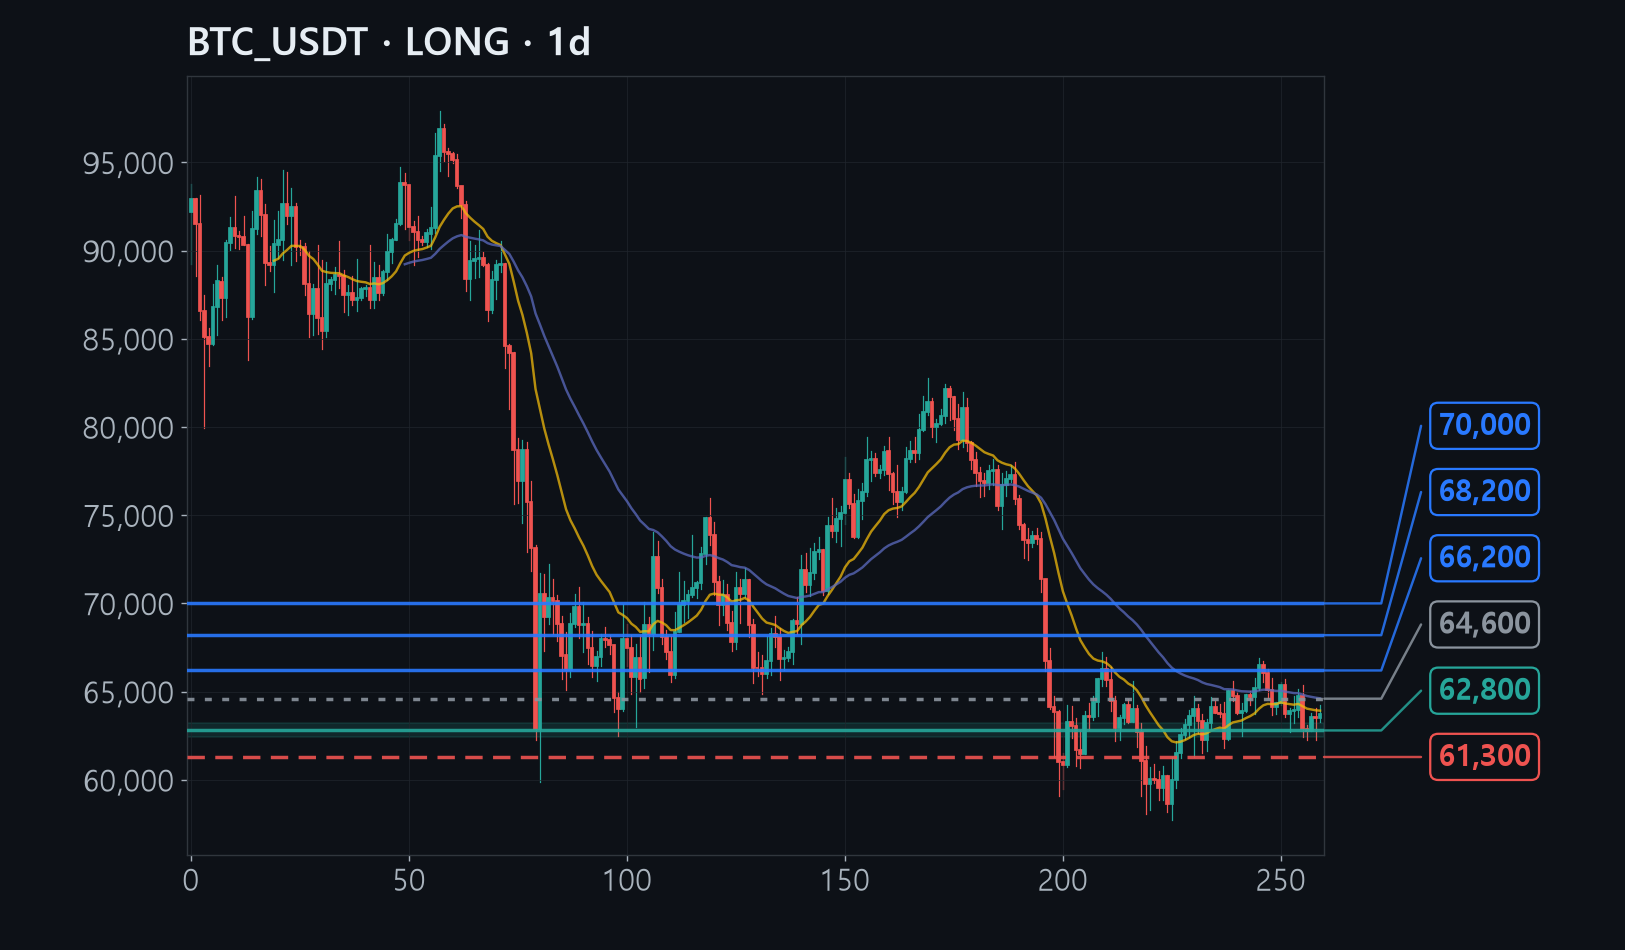
Bitcoin has bounced off a floor near $62,000, but it still trades well below its one-year average price, so the larger trend remains downward.
Evidence that selling was exhausted at the recent low, the rebound that followed, and the lower edge of the yearly range all overlap between $62,400 and $63,200.
If that floor gives way and a daily candle closes below $61,300, the entire rebound case collapses, which is exactly why the stop sits just beneath it.
The full analysis is for members
Analysis by methodology (ICT, Wyckoff, Elliott, divergence, macro, news), invalidation levels, R:R and confidence are in the member report.