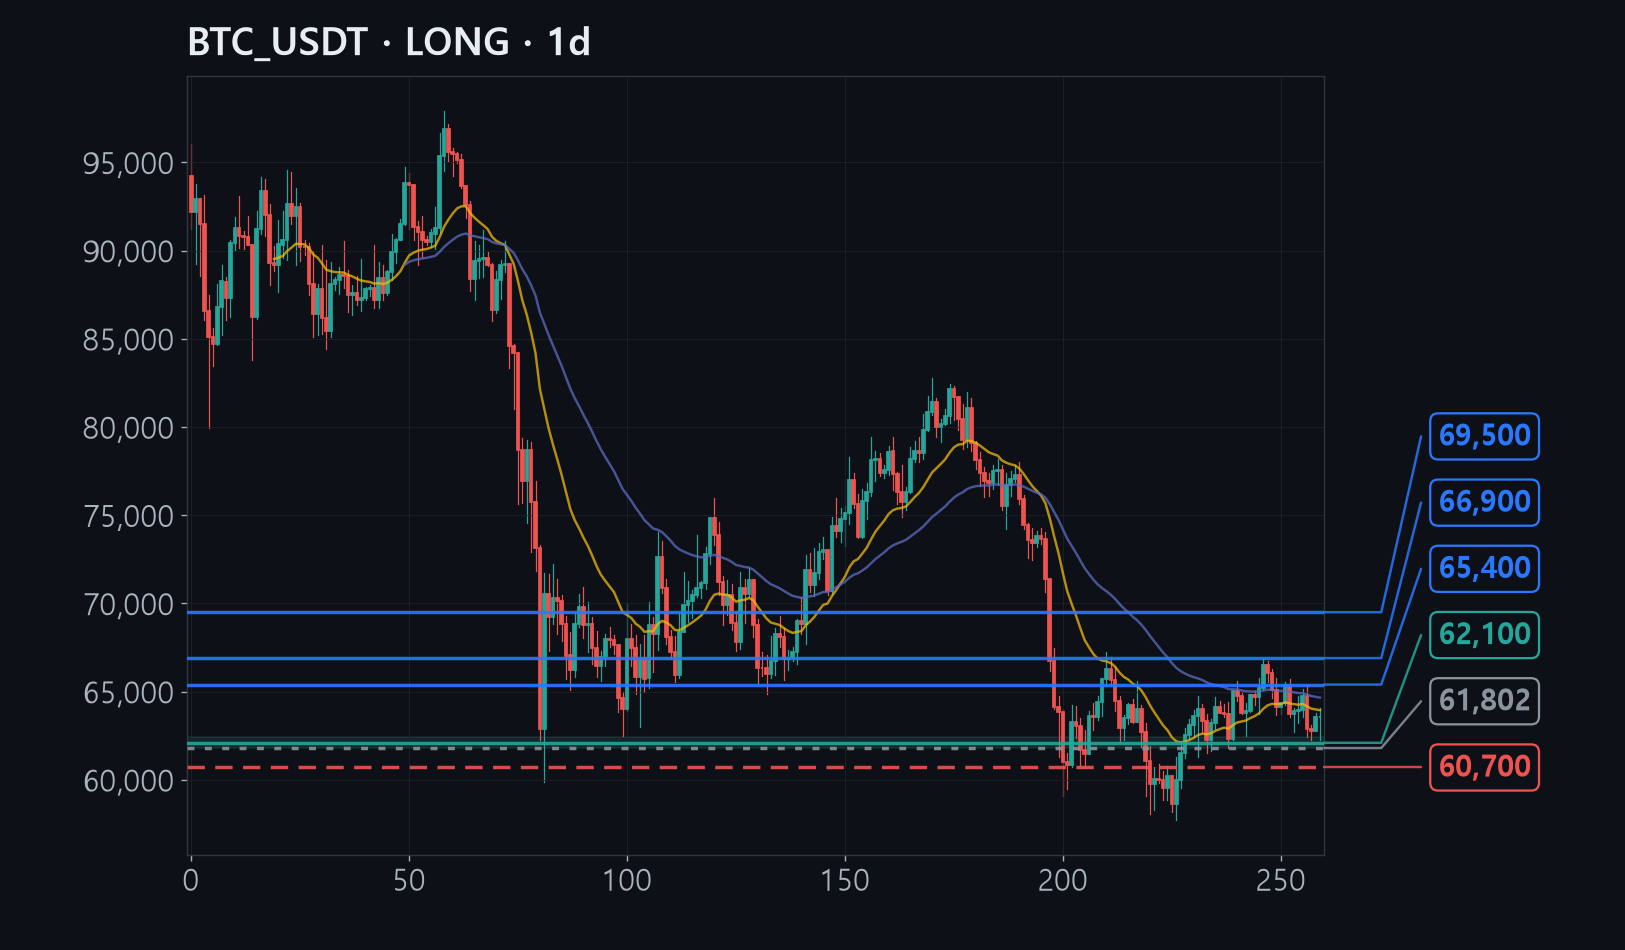
Bitcoin slid from 67,000 to 57,700 last month and has spent the past few weeks moving sideways around 63,000, grinding out a base rather than trending.
At 57,700 price made a lower low while selling pressure weakened, and the halfway retracement of that bounce overlaps prior-low support near 62,000.
If 60,700 breaks on a daily close, the pattern of progressively higher lows is broken, which is exactly why the stop sits just underneath that level.
The full analysis is for members
Analysis by methodology (ICT, Wyckoff, Elliott, divergence, macro, news), invalidation levels, R:R and confidence are in the member report.