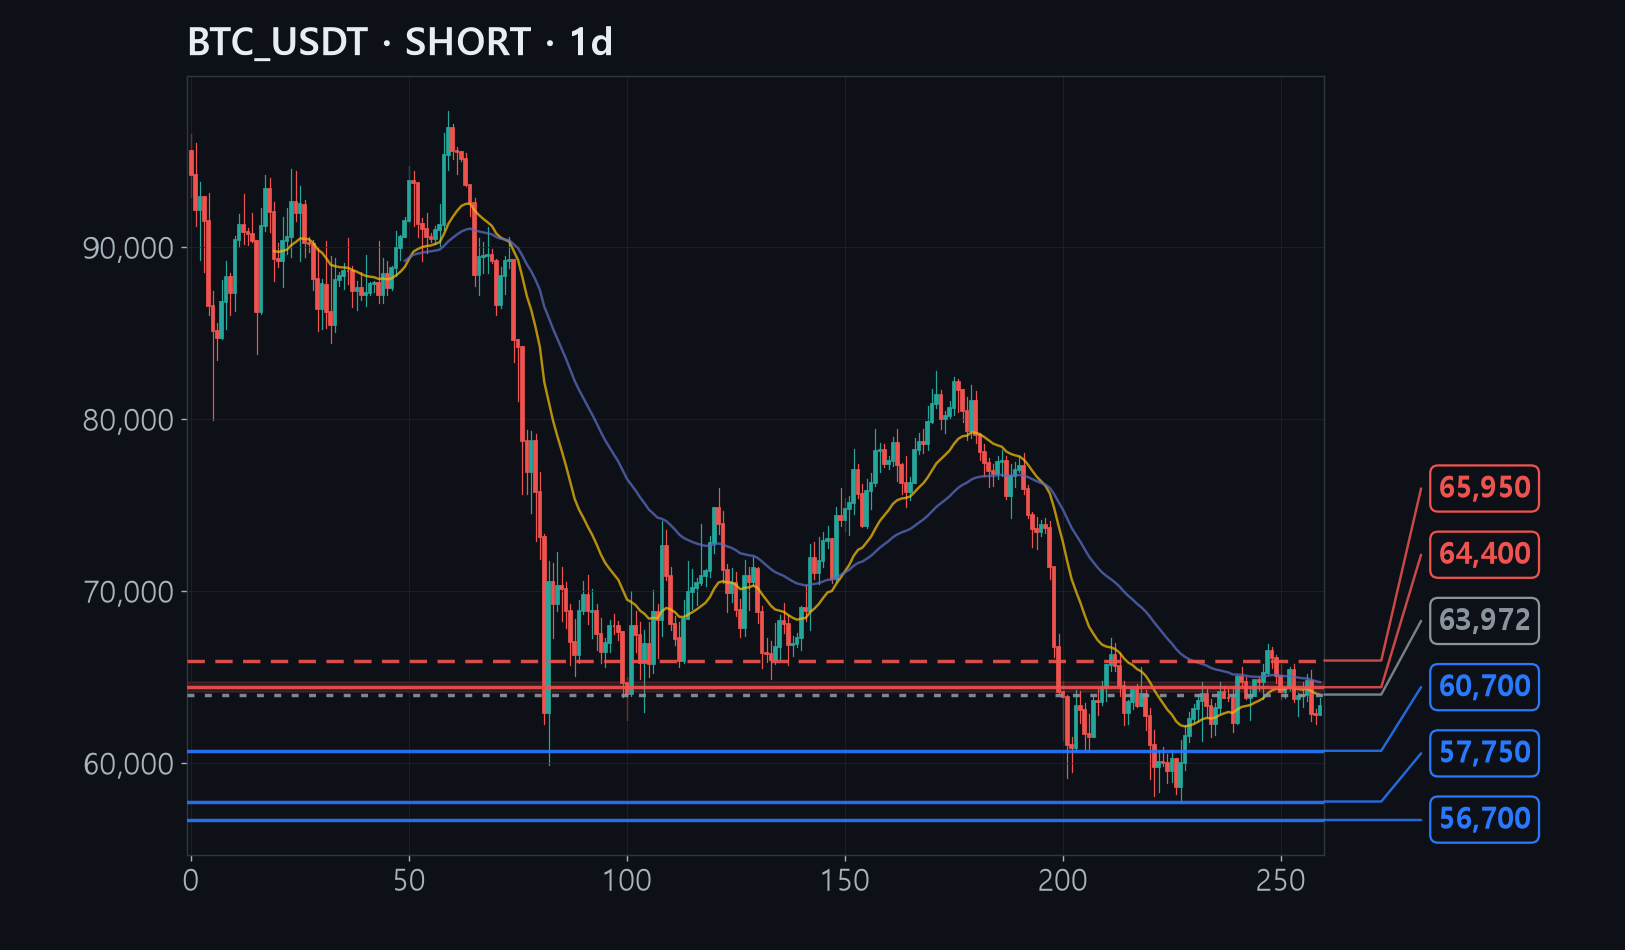
Bitcoin has been sliding since its $66,900 peak two weeks ago and is now stuck between $62,000 and $64,000, unable to pick a direction.
Four of six frameworks pointed lower, and the 20-day and 50-day average price lines meet the halfway retracement of the last drop right at $64,400.
If price climbs back above the previous bounce high at $65,735, the downtrend structure is broken - which is exactly why the stop sits just above it at $65,950.
The full analysis is for members
Analysis by methodology (ICT, Wyckoff, Elliott, divergence, macro, news), invalidation levels, R:R and confidence are in the member report.