BEARISH
BTC BEARISH · 4h
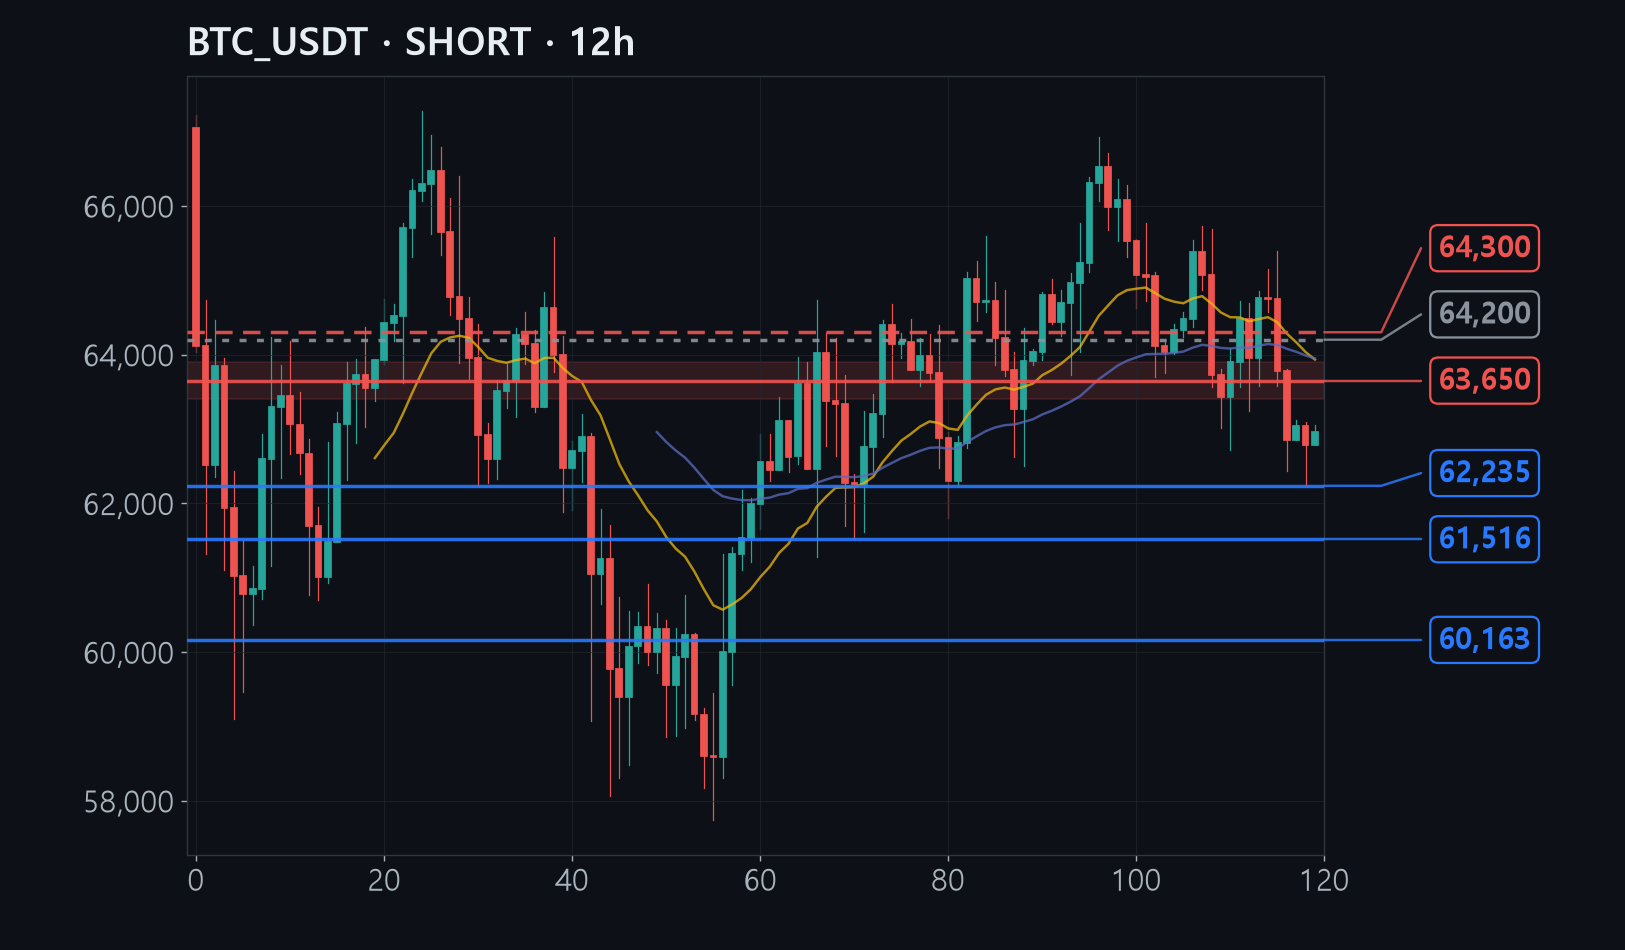
ENTRY63,400~63,900TARGET62,235STOP64,300
In 3 lines
- Bitcoin has been sliding since it was rejected near $67,000, making a lower high on every bounce and holding below the $63,000 line.
- Four average-price lines bunch at $63,400-$63,900, where the last failed bounce and leftover unsold supply also sit — that overlap is where we sell.
- If price climbs above $64,300, that resistance band has broken and the bearish read is simply wrong, which is exactly why the stop sits there.
The full analysis is for members
Analysis by methodology (ICT, Wyckoff, Elliott, divergence, macro, news), invalidation levels, R:R and confidence are in the member report.
See how to join →