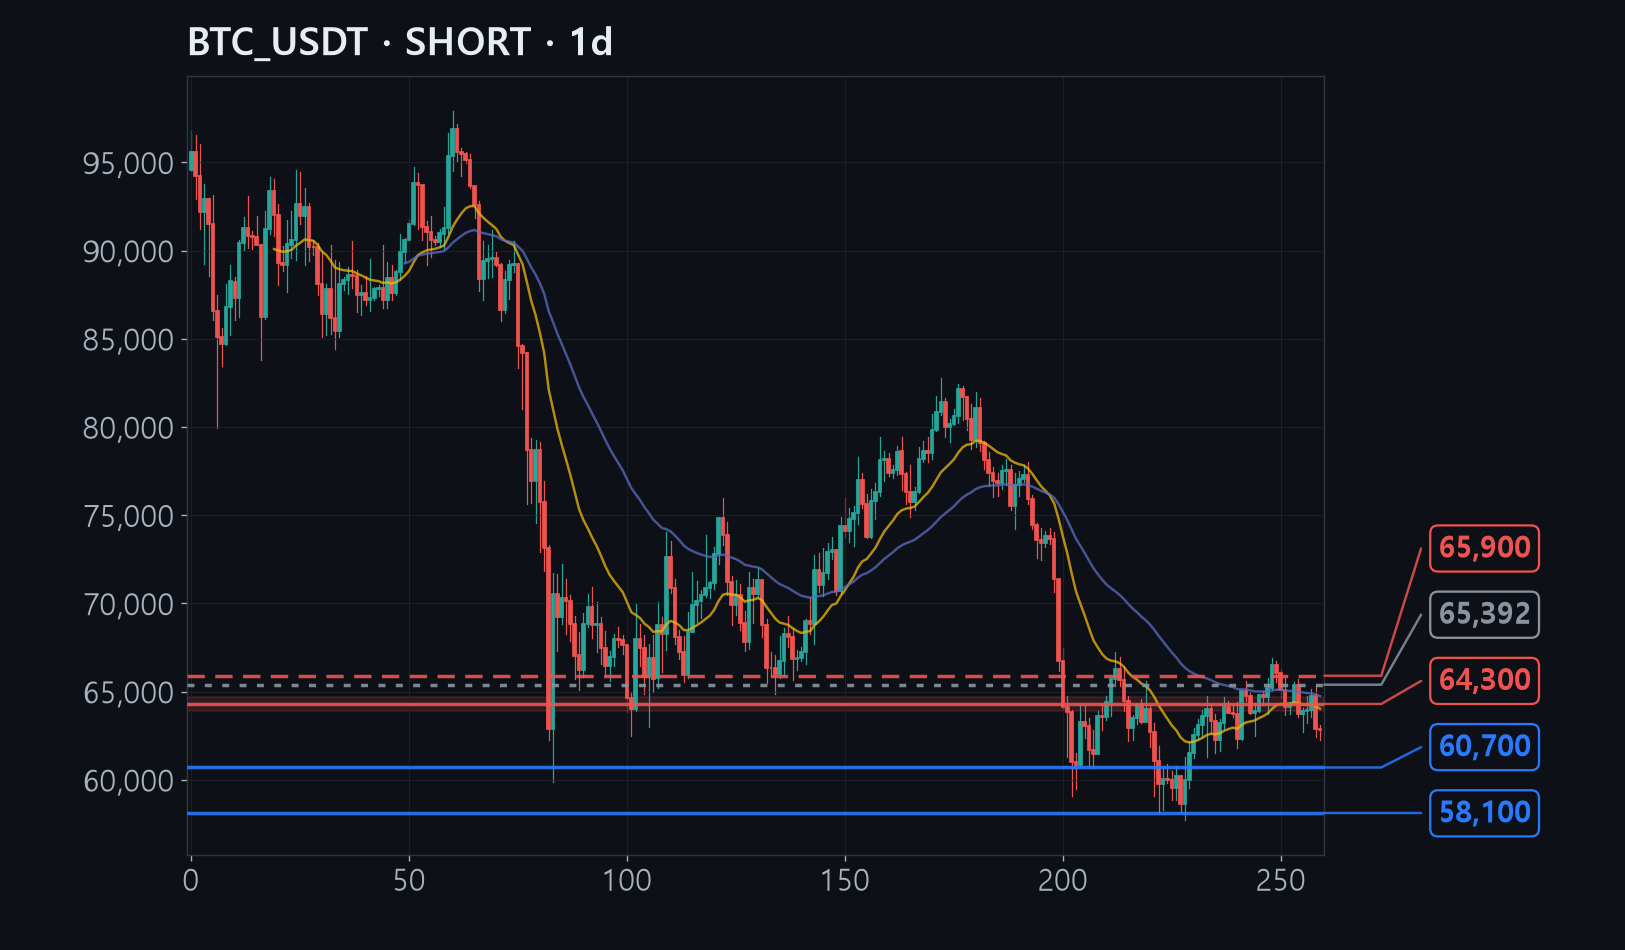
Bitcoin peaked at $66,900 and has slid since, capped at a lower high on every bounce, and now trades near $62,800 well below its one-year average price.
Four of six analysis methods point down, and near $64,000 the short-term average price line overlaps the exact level where the recent sharp drop began.
If a bounce pushes through that band and settles above $65,900, the bearish read is simply wrong, which is why the stop sits just above it.
The full analysis is for members
Analysis by methodology (ICT, Wyckoff, Elliott, divergence, macro, news), invalidation levels, R:R and confidence are in the member report.