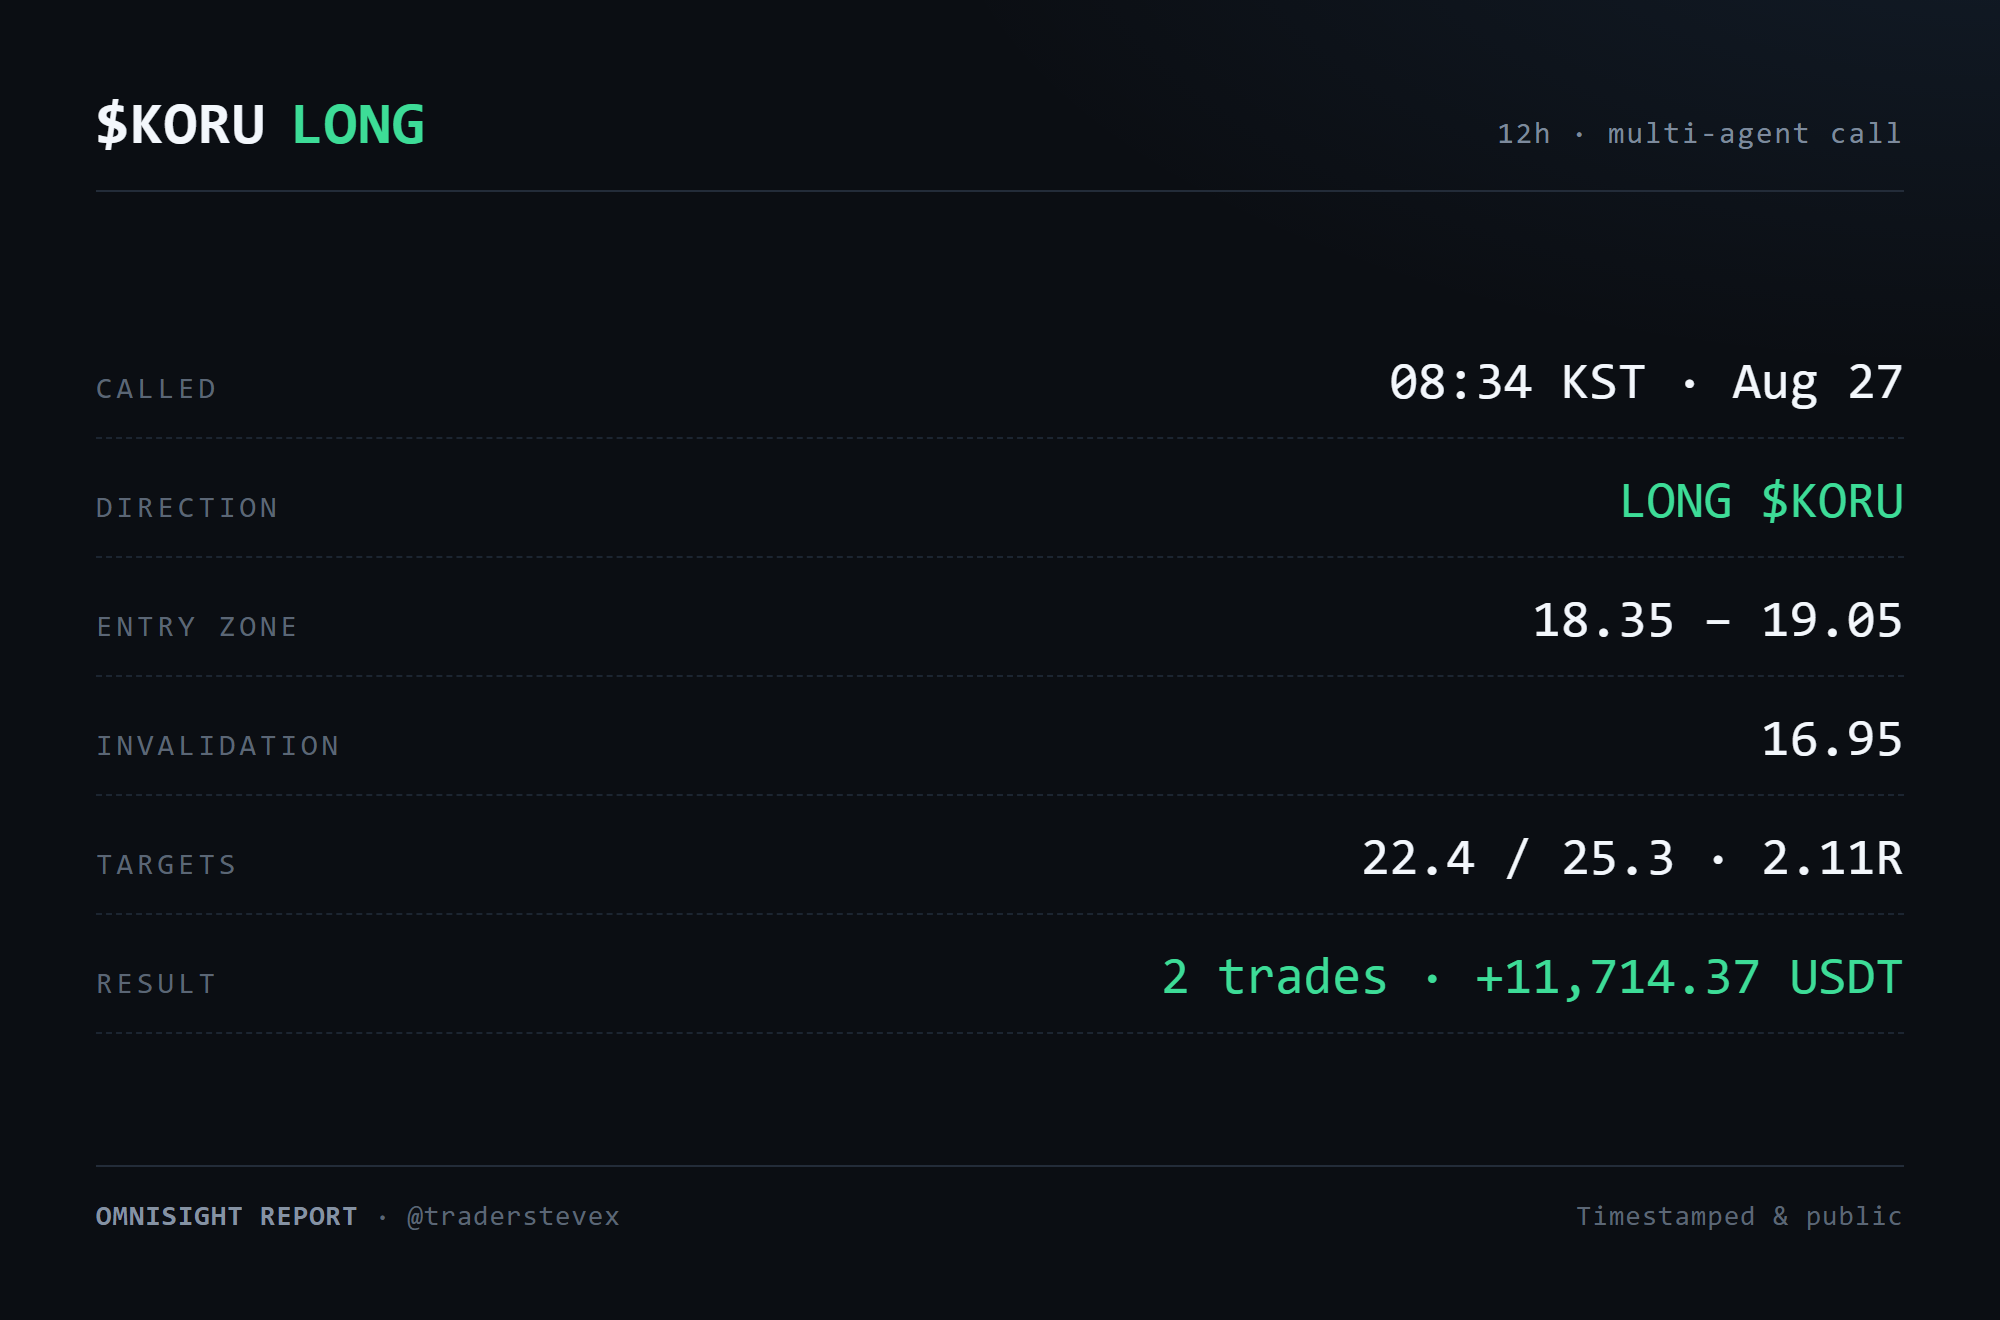
KORU long paid +11,714 USDT while the planned entry never filled
Trades
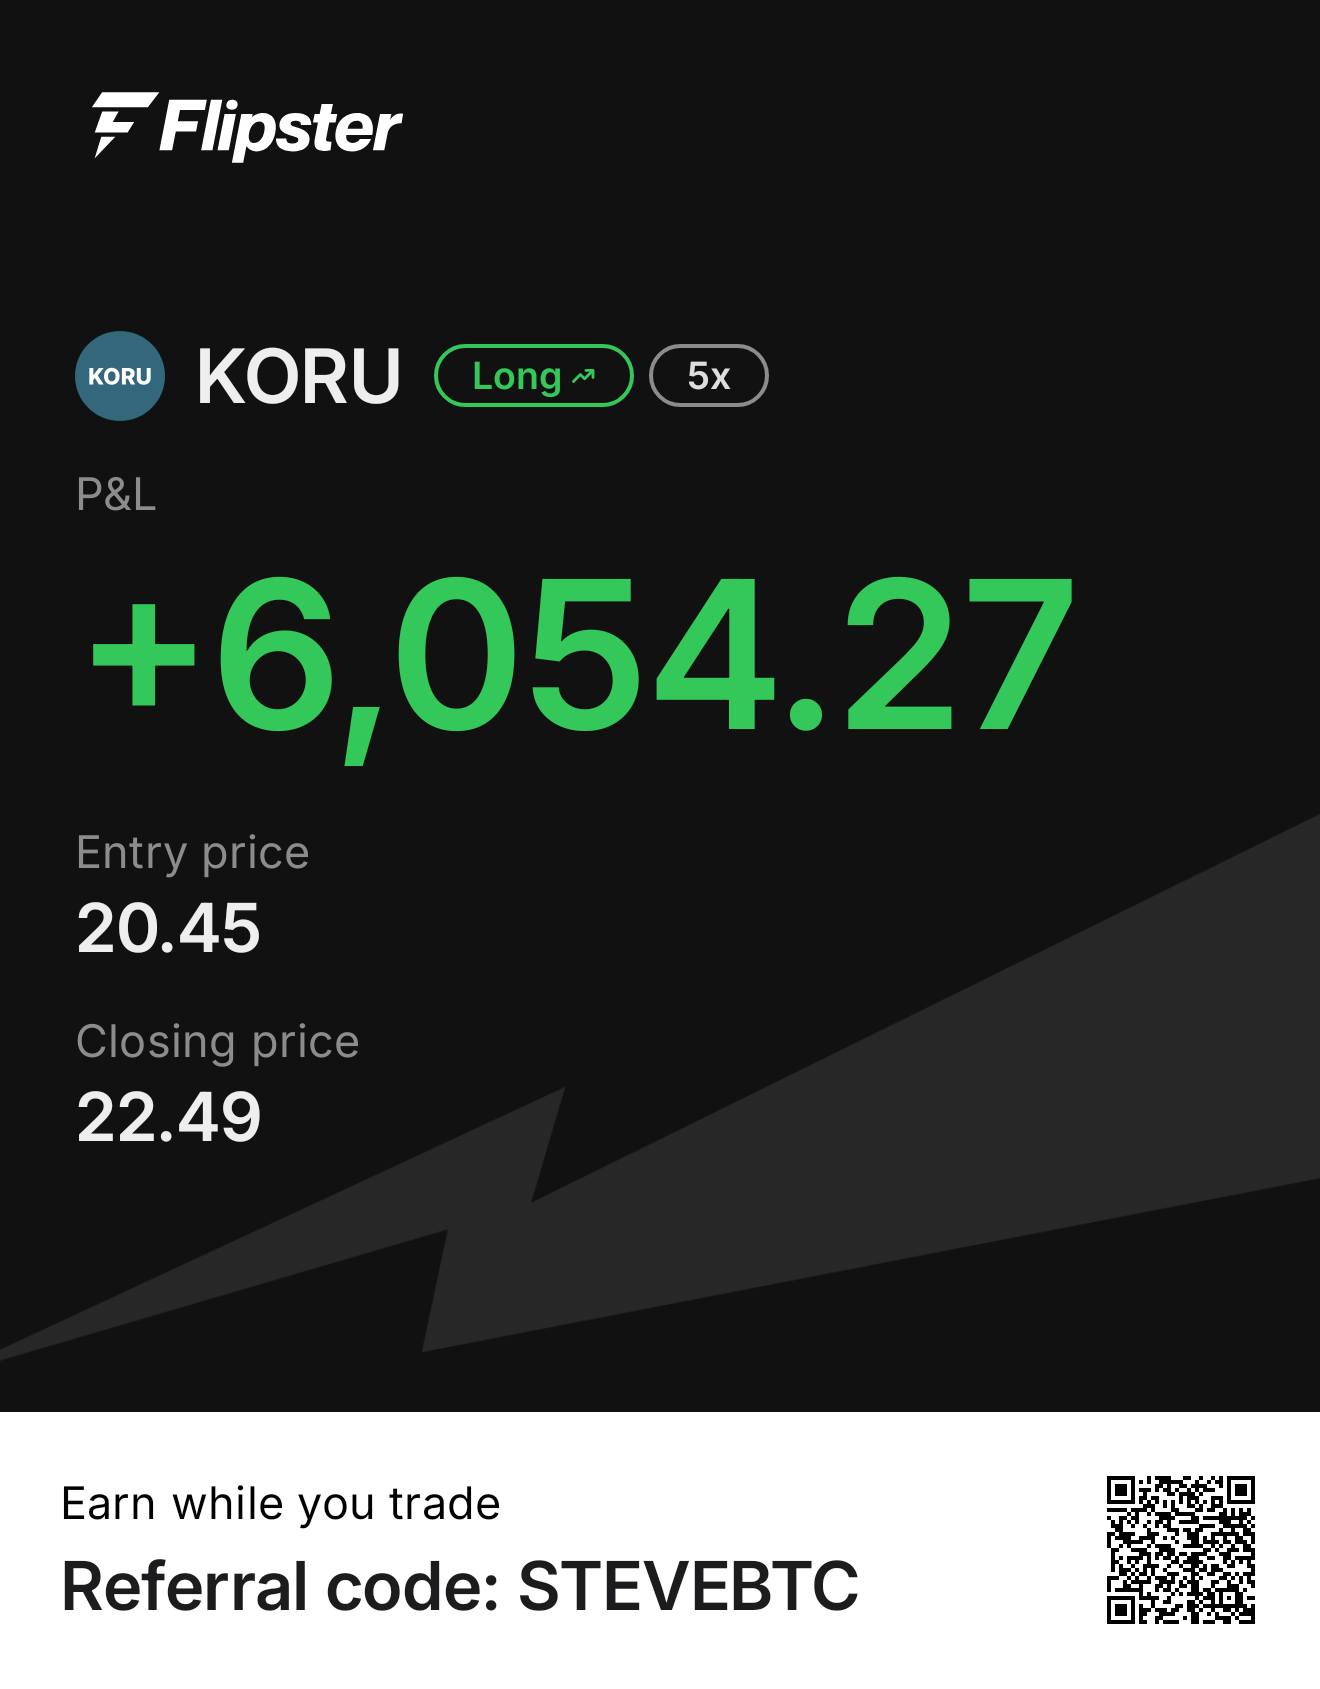
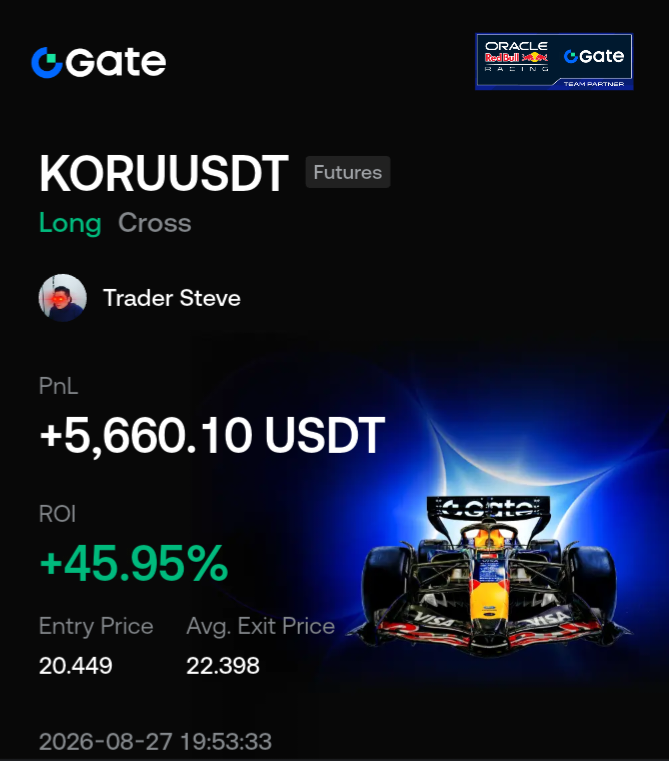
| # | Side | Entry | Exit | Size | P&L |
|---|---|---|---|---|---|
| 1 | LONG | 20.45 | 22.49 | 5x | +6,054.27 |
| 2 | LONG | 20.449 | 22.398 | 5x | +5,660.10 USDT +45.95% |
| Total Trades 2 · W/L 2/0 | +11,714.37 USDT | ||||
Two same-direction KORU longs on separate exchanges (Flipster + Gate), summed per the hedge-across-venues rule: 6,054.27 + 5,660.10 = 11,714.37. Flipster's card shows no currency label next to +6,054.27; it is treated as USDT (Flipster perps settle in USDT) but the unit was not explicitly printed. A third attached image was an unrelated ETH report card uploaded by mistake; it was never counted as a trade and has been removed from this page.
View original analysis report →
The receipt
Two KORU long positions, both 5x, opened across two venues to spread execution risk. Flipster took the entry at 20.45 and the close at 22.49 for +6,054.27, while Gate entered at 20.449 with an average exit of 22.398, a +45.95 percent return that settled +5,660.10 USDT at 19:53 on August 27. Counted as the two separate fills they are, the pair returned +11,714.37 USDT. Both green, no loser in the set.
The setup
This was not an obvious spot at the time. $KORU had fallen to a third of its June peak, then clawed back about 76 percent off the recent low, and by the call it was shuffling sideways near 20 dollars. The internal read was long but cautious, a 58 out of 100 conviction the notes themselves called unanimous but individually weak. Four technical methods leaned long, the news desk abstained for lack of a catalyst inside the 24-hour window, and nobody argued the short side.
The signals
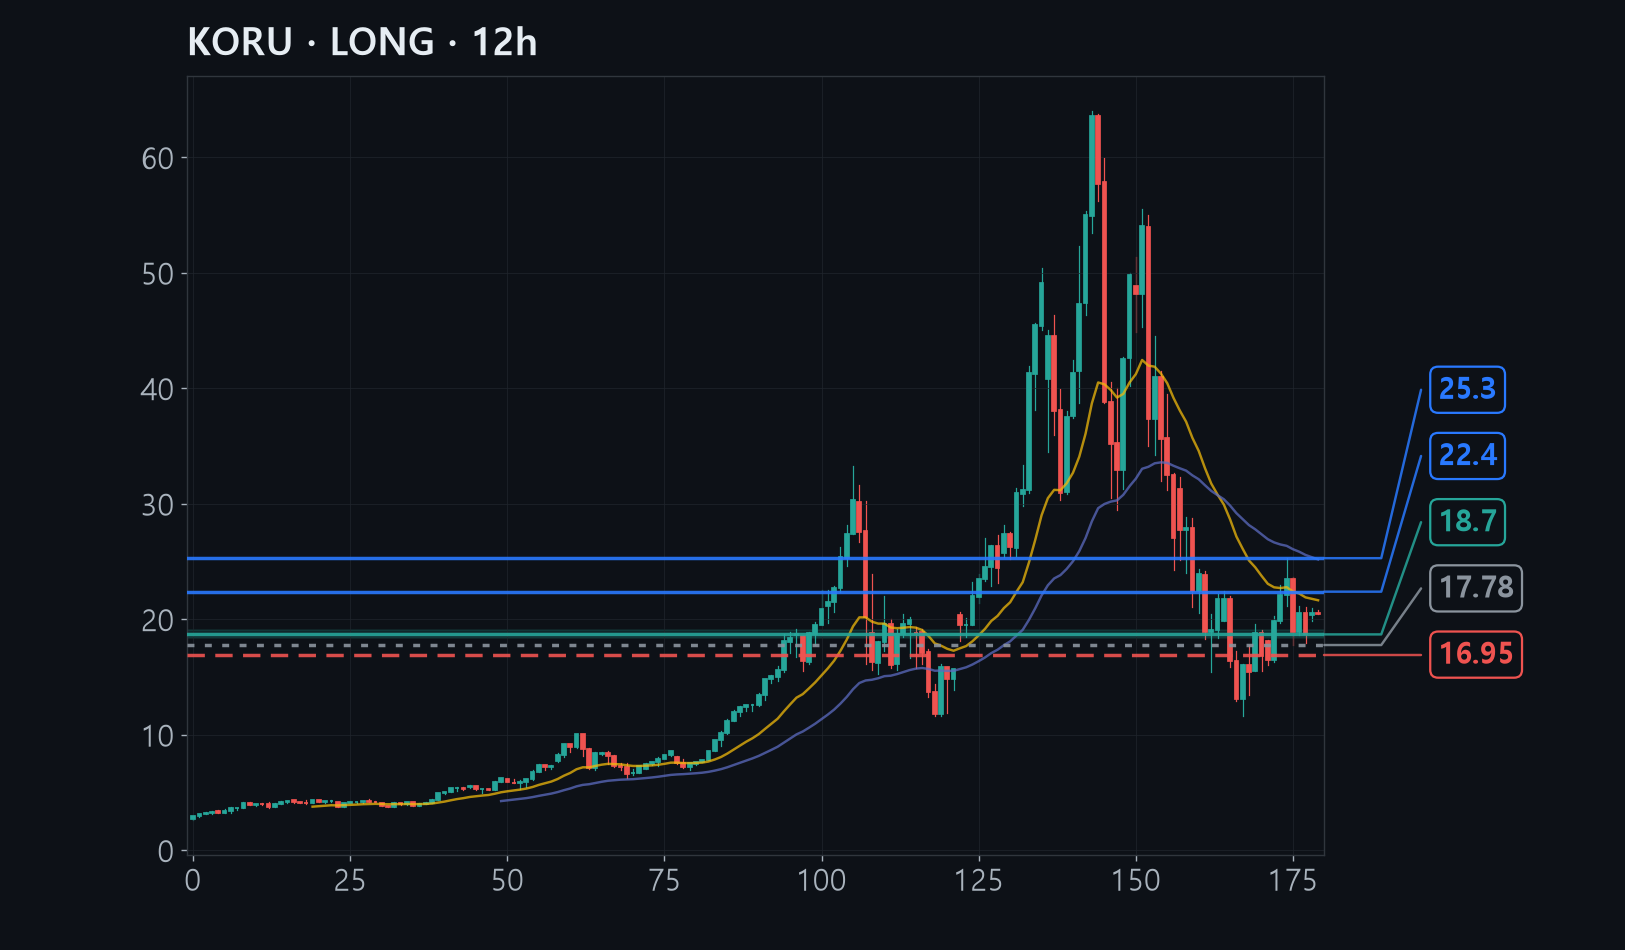
Market structure had genuinely turned: five consecutive higher 4h swing lows from 11.65 to 17.94, with the 12h MACD histogram flipping from -2.99 to +0.86. The cross-check mattered more than the chart itself. $KORU is a 3x daily-reset vehicle, so the June round trip left it down 67.6 percent while EWY, tracking the same Korea index, was down only 18.3 percent, and that gap is decay rather than a sick market. The detail worth keeping is a data correction: the raw snapshot put the daily EMA200 at 20.06, which would have said price was already above it, but recomputed over two years it was 22.45, so price was still below the intermediate average, and that single flip is why conviction stayed pinned at 58 instead of drifting higher.
What would have killed it
The line in the sand was a 12h close under 17.78, with the hard stop below it at 16.95 and the cleaner tell being EWY losing its August 18 low of 169.95. An Elliott alternate count kept a C-wave leg lower alive at the 50-conviction mark, and Warsh's first Jackson Hole keynote on August 29 sat inside the holding window as a two-sided risk that 3x leverage would amplify. But the thing that nearly made this a no-trade was the plan itself. The entry was a resting limit at 18.35 to 19.05, roughly 8 percent below spot, and the report said plainly that if it never filled, ending with no trade was the correct outcome. Price never discounted. It went up, and a disciplined limit sitting that far under a firm tape would have caught nothing.
The lesson
Direction and the first target were right to the cent: T1 was mapped at 22.40 and both exits printed 22.398 and 22.49. The entry model was the part that missed, demanding a discount a strong tape was never going to hand over. Those two things deserve to be logged separately. A correct direction paired with a mispriced entry is still a real result, and it belongs in the record rather than tucked away. Chasing above a resting-limit plan is a deviation with its own cost, less cushion and a worse average price, and it paid here only because the direction work was sound. The reusable rule is simple: when a plan's fill hangs on a pullback the market may refuse, decide in advance whether you take it at market or take nothing, because the model already told you which it preferred.